Toward the Personalization of Copyright Law
In this Essay, we provide a blueprint for personalizing copyright law in order to reduce the deadweight loss that stems from its universal application to all users, including those who would not have paid for it. We demonstrate how big data can help identify inframarginal users, who would not pay for copyrighted content, and we explain how copyright liability and remedies should be modified in such cases.
Introduction
The dominant justification for copyright protection is that it is necessary to remedy an underproduction problem that arises from the public-good nature of expressive works.1 According to economic theory, public goods display two characteristics: nonrival consumption and nonexcludability of benefits.2 The former trait implies that the use of a copyrighted work by one individual does not diminish consumption opportunities for others. The latter means that even users who did not pay for the provision of copyrighted content benefit from it. Furthermore, once a work is produced, it can be copied by others and offered to the public at a price that does not allow the original authors to recoup the investment required to produce the work. Without legal protection, therefore, not enough copyrighted works would be created.
The legal exclusivity granted to copyright owners is intended to prevent unauthorized use of copyrighted content and ensure that authors are remunerated for their creative labors. The authors’ monetary rewards come from voluntary market transactions between the authors and users of the works. To prevent attempts at bypassing the market, copyright law imposes sanctions on unauthorized users of copyrighted material.3
Critically, though, from an economic perspective, our copyright system does not represent a first-best solution. The grant of legal exclusivity to authors introduces the problem of supracompetitive (or monopolistic) pricing. Consequently, users who would have been willing to buy at the competitive price are denied access to content. And the penalties that are imposed on all unauthorized users come with a social cost: they drive away potential users of copyrighted content who derive positive value but cannot afford to pay the asking price. Preventing such users from accessing copyrighted works decreases their welfare without enhancing the creators’ incentives to create because these potential users never provide any revenue for sellers.
The existence of big data regarding the characteristics of copyright users can fundamentally transform copyright law by significantly decreasing its social cost. Big data can facilitate the personalization of copyright law via differentiating between paying users, who potentially attribute a higher value to the content than the asking price, and inframarginal users, who most likely will attribute a lower value to the content than the asking price and barely participate actively in the copyright market. Copyright law could differentiate between the penalties that would be imposed on different types of users who infringe copyrights, imposing high penalties on the paying user and low penalties on the inframarginal user. Such personalization is welfare enhancing, compared to the existing regime, as it will increase the use of copyrighted content.
The use of big data can also help bring about a fairer and more efficient copyright enforcement regime. At present, all unauthorized users are treated similarly, irrespective of whether they would have paid for the right to use the work. While enforcement against users who could afford to pay the asking price is vital for the successful operation of our copyright system, the imposition of sanctions on inframarginal users is welfare diminishing, as it denies them a benefit that inflicts no harm on copyright owners. A prior study by one of us suggested personalizing copyright protection by granting copyright holders a basic set of protections and allowing them to decide whether to purchase additional levels of protection.4 In this proposal, we suggest personalizing copyright protection based on certain characteristics of copyright users through the utilization of big data.
We analyze data that contain demographic characteristics of consumers of copyrighted content in order to detect cohorts that abstain from purchasing such content. We focus on purchases of audio and video content. We utilize two sources of data that complement one another. The first source is data from the Consumer Expenditure Survey of the Bureau of Labor Statistics, which provide us with a general picture of audio and video purchases.5 The second is panel data from ComScore, which include detailed information regarding the online consumption patterns of over eighty thousand households from various backgrounds, including their full demographic characteristics. Analysis of these data sets enables us to detect potential groups with a low propensity to purchase copyrighted material based on cross-sections of demographic categories, such as household education and racial background.
Our empirical analysis is only the first step in utilizing big data for the purpose of personalizing copyright law. In order to identify accurately the individuals who would not purchase copyrighted content, it is necessary to work with a much bigger data set than that which was available to us. Concretely, one would need to establish or compile a more comprehensive data set based on a larger sample that includes panel data and maybe even behavioral categories. It would also be useful to create a data set that tracks the consumption of different genres. The purpose of our admittedly partial analysis is only to demonstrate the general feasibility of deducing from even basic demographic data the probability that a certain household would not buy copyrighted materials and the general form in which a personalized copyright regime should be molded.
Our argument and results give rise to several implications for legal policy. First, by enabling differential pricing of copyrighted content, personalized consumption data will reduce the deadweight loss associated with copyright protection. Second, the consumption patterns we report suggest that a more limited copyright regime should apply to certain cohorts with a lower propensity to purchase content. Third, and relatedly, based on our findings, we propose varying the sanctions imposed for unauthorized uses of copyrighted content based on user characteristics.
Structurally, our Essay is comprised of five parts. In Part I, we present the data sources that offer information about the consumption patterns of copyrighted content and the characteristics of the consumers. In Part II, we analyze the data we collected and summarize our empirical findings. In Part III, we discuss the significance, as well as the limitations, of our findings. In Part IV, we assess the implications of our findings for copyright law and policy. In Part V, we explain why the market alone would not lead to a full personalization of copyright law and hence why legal intervention is warranted. In the Conclusion, we identify the central attribute of our argument and briefly address its applicability to the consumption of other public goods.
I. General and Expenditure Survey Data
Until recently, user-specific pricing was considered a purely theoretical possibility, and its implementation in the real world was deemed unrealistic.6 The emergence of big data regarding the characteristics of users of copyrighted works will go a long way toward turning this theoretical possibility into reality. There exist abundant data regarding the characteristics of various types of users who consume music and movies.
Since 2016, online listening has been the most dominant form of music consumption.7 According to the 2016 Nielsen Music Year-End Report, on-demand audio streaming comprises 38 percent of total audio consumption in the United States.8 It is on the rise, and a steep rise it is: it has grown 76.4 percent relative to the figures from 2015.9 Movie and video consumption has also shifted toward streaming: 2016 was the first year in which the majority of Americans (50.8 percent) watched a TV show online at least once a month.10 This is a 3 percentage point jump from 2015, in which only 47.8 percent of Americans watched a show online at least once a month.11 According to the 2017 Nielsen Video 360° Report, 52 percent of survey respondents claimed that they had not purchased a physical video in 2016.12 Online streaming consumption significantly increases the ability to track and extract specific information regarding the characteristics (name, geographic location, age, gender, and many more) and behavior of the consumer through obtaining browser activity and cross-checking with other databases, such as credit-score bureaus and online consumption of alternative services.
The high commercial value of the information regarding the characteristics of consumers of music and movies has prompted business enterprises, such as ComScore,13 Quantcast,14 and Musicwatch,15 to establish big data sets on users. Other businesses, such as Tellapart, have collected general data regarding consumers’ characteristics and behavior and advised firms on how to utilize this information.16 While this information is available, it is very expensive to obtain due to its high commercial value.17 In this Essay, we utilize a large set of data collected by ComScore in order to demonstrate the feasibility of detecting the profiles of consumers with a low probability of purchasing copyrighted content.18 Our data set focuses on the purchase of audio and video content. The analysis of the ComScore data is instructive of how it is possible to utilize existing big data to detect population segments with a low propensity to purchase copyrighted content. In addition, we use Bureau of Labor Statistics Expenditure Survey data, which is a useful complement to our other data sources, although it is less extensive than the ComScore data.19 We utilize an analysis of the 2010 Bureau of Labor Statistics Expenditure Survey data published by New Strategist in Best Customers: Demographics of Consumer Demand.20
According to the Best Customers data, while the expenditure of an average household on audio streaming and downloading is $6.70, households in which the householder is age seventy-five and above spend an average of $0.55.21 In contrast, the average monthly spending of households in which the householder is age thirty-five to forty-four is $10.81—almost twenty times as much.22 The Best Customers Index score—which is based on the ratio of the groups’ average expenditures to the general population’s average expenditures,23 indicating the group’s propensity to make purchases in a given category—is 8 for the former group and 161 for the latter.24
Households with annual incomes of less than $20,000 spend less than a third of what the average household spends on audio streaming and downloads.25 The average household spends an average of $6.70 per month on streaming and downloading music, while households with annual incomes of less than $20,000 spend an average of $1.90.26 In contrast, households with annual incomes of $100,000 or more spend over three times more than the average household on copyrighted content online, and over ten times more than households with incomes of less than $20,000.27 The former group scores 28 on the Best Customers Index, while the latter scores 303.28
Household type also affects the probability that a household will spend resources on streaming and downloading audio. A household with a married couple in which the oldest child is between the ages of six and seventeen spends an average of $16.15 on consumption of audio content, which gives it a score of 241 on the Best Customers Index, while a household consisting of a single parent with one or more children under eighteen will spend an average of $2.38, which gives it a score of 36 on the Index.29 Black households spend an average of $4.24 (a score of 63), while non-Hispanic whites spend an average of $7.44 (a score of 111).30
Education appears to be an even more important factor. There appears to be a strong positive correlation between education level and consumption of copyrighted content. A household with no high school graduates spends an average of $0.87 on digital audio content (a score of 13), while a household with a holder of a master’s degree spends an average of $16.18 (a score of 241).31
Region may also affect users’ propensity to consume copyrighted content: an average southern family spends $5.12 (a score of 76), while an average midwestern household spends an average of $8.33 (a score of 124).32 The data further indicate that a black southern family with a child under the age of eighteen and a single parent age seventy-five and above who has not graduated high school has a virtually zero probability of spending money on streamed or downloaded audio.33
The data regarding spending on streaming and downloading of video content based on income are not fundamentally different. While, in general, the effect of income on the categories of consumption is weaker, there are other categories in which the differences are more pronounced. The effect of household income on expenditures in this category is weaker: the average monthly spending of a household with an income of less than $20,000 is $0.57, while that of a household with an income of above $100,000 is $4.98.34 The score of the latter on the Best Customers Index is 257, which is significantly lower than the score of 303 it receives on the streaming and downloading of audio content.35
The differences are also less pronounced among different household types. The household type with the highest average consumption (married couples with children aged six to seventeen) spends on average $3.04, while the household type with the lowest (single parents with children under the age of eighteen) spends an average of $0.80.36 This means that the difference in spending between the highest and lowest categories is only four-to-one, significantly less than the gap in audio consumption, which was almost eight times greater.37
Yet in some demographic categories, the difference is more pronounced for video. Black households spend an average of $0.80 in comparison to non-Hispanic white households, which average $2.11—over two and a half times more.38 For audio, they spend less than two times more.39 Black households’ Best Customers Index score drops from 63 for audio to 41 for video.40
II. Analysis of ComScore Data
There are two methods by which ComScore reaches out to these households. The first is through the “Affiliate Program,” in which users receive direct invitations to download software that would enable ComScore to collect information about all browsing activity in the household.41 Users are not paid. The incentive to participate is intrinsic. The second is through third-party application providers that offer incentives to visitors in exchange for exposing visitors to offers, including solicitations from ComScore.42 Yet no incentive is tied to the acceptance of the offer from ComScore.43 ComScore also collects users’ household-level demographics, which it supplements with third-party data from Accudata and behavior-based modeling.44 ComScore panel data is weighted in order to reflect the universe of internet users in the United States.45
We have obtained ComScore data for two categories of online purchases relevant to our Essay: Purchase of Music (ComScore category twenty-two) and Purchase of Movies and Videos (ComScore category twenty-three).46 The data set contains observations for 81,417 households. It contains 3,315 observations of audio content purchased by households and 10,726 observations of video content purchased by households. Because our main interest is the characteristics of households that do not buy copyrighted materials, we divided these households into two types: households that have purchased certain forms of copyrighted material—audio or video—and households that have not purchased those forms of material. Because there are numerous households that have purchased one or more products in either category, the number of households that haven’t purchased any product is 1,577 for audio and 4,467 for video (see Tables 1 and 2).
|
Audio |
Frequency |
Percent |
Cumulative |
|---|---|---|---|
|
0 |
79,840 |
98.06 |
98.06 |
|
1 |
1,577 |
1.94 |
100.00 |
|
Total |
81,417 |
100.00 |
|
|
Video |
Frequency |
Percent |
Cumulative |
|---|---|---|---|
|
0 |
76,950 |
94.51 |
94.51 |
|
1 |
4,467 |
5.49 |
100.00 |
|
Total |
81,417 |
100.00 |
|
For each of the households, the data contain nine parameters: Education Level of the Head of Household, Census Region, Household Size, Oldest Age of the Head of Household, Household Income, Racial Background, Connection Speed, Country of Origin, and Zip Code.
We set out to examine whether these parameters are correlated and have predictive power for whether a household with certain characteristics would purchase a protected copyright product. For this purpose, we ran a logistic regression, which is most fitting given the binary character of the dependent variable. For audio consumption, four of the independent variables were statistically significant: Racial Background and Age with strong significance (p < 0.01) and Census Region and Income with weaker significance (p < 0.05). Non–African American households (African American households are denoted by the number “3” in Table 3), older heads of households, and low-income households have a higher probability of not purchasing audio content. Among the variables, racial background has the highest coefficient and therefore seems to have the strongest impact.
| Audio | Coeff | Std Err | z | P > |z| | [95% Conf Interval] | |
|---|---|---|---|---|---|---|
| Most Education (Head of Household) | 0.0586541 | 0.0338642 | 1.73 | 0.083* | −0.0077184 | 0.1250266 |
| Census Region | ||||||
| 2 | −0.240163 | 0.0829241 | −0.29 | 0.772 | −0.1865444 | 0.1385119 |
| 3 | −1.662921 | 0.0748991 | −2.22 | 0.026*** | −0.3130917 | −0.0194926 |
| 4 | −0.0343664 | 0.0849173 | −0.40 | 0.686 | −0.2008013 | 0.1320685 |
| Household Size | −0.0048801 | 0.0207302 | −0.24 | 0.814 | −0.0455105 | 0.0357503 |
| Oldest Age Head of Household | 0.0761591 | 0.011749 | 6.48 | 0.000*** | 0.0531315 | 0.0991867 |
| Household Income | 0.0318705 | 0.0146177 | 2.18 | 0.029** | 0.0032204 | 0.0605206 |
| Racial Background | ||||||
| 2 | −0.9354766 | 0.1186563 | −7.88 | 0.000*** | −1.168039 | −0.7029146 |
| 3 | −0.4714563 | 0.1202855 | −3.92 | 0.000*** | −0.7072116 | −0.2357011 |
| 5 | −0.9063577 | 0.0922049 | -9.83 | 0.000 | −1.087076 | −0.7256395 |
| Country of Origin | ||||||
| 1 | 0.1004516 | 0.0935218 | 1.07 | 0.283 | −0.0828478 | 0.2837509 |
| _cons | −4.496677 | 0.2318364 | −19.40 | 0.000 | −4.951068 | −4.042286 |
* For Census Region: 1 = North East, 2 = North Central, 3 = South, 4 = West. For Racial Background: 1 = Caucasian, 2 = African American, 3 = Asian, 5 = Unknown. For Country of Origin: 1 = Hispanic, 2 = Non-Hispanic.
We have received similar results with regard to household consumption of video content. Racial Background and Age of Households remain strongly statistically significant (p < 0.01), joined by Region, which had enhanced statistical significance (p < 0.001). Household Income maintains its weaker statistical significance (p < 0.05), while Education loses its statistical significance.
| Video | Coeff | Std Err | z | P > |z| | [95% Conf Interval] | |
|---|---|---|---|---|---|---|
| Most Education (Head of Household) | 0.0123945 | 0.020856 | 0.59 | 0.552 | −0.0284825 | 0.0532714 |
| Census Region | ||||||
| 2 | −0.0981939 | 0.0508895 | −1.93 | 0.054 | −0.1979355 | 0.0015476 |
| 3 | −0.235507 | 0.0455328 | −5.17 | 0.000*** | −0.3247496 | −0.1462644 |
| 4 | −0.1264669 | 0.0523088 | −2.42 | 0.016 | −0.2289902 | −0.0239435 |
| Household Size | −0.0004744 | 0.0126332 | −0.04 | 0.970 | −0.025235 | 0.0242861 |
| Oldest Age Head of Household | 0.0292329 | 0.006974 | 4.19 | 0.000*** | 0.0155642 | 0.0429016 |
| Household Income | 0.0201468 | 0.0089904 | 2.24 | 0.025** | 0.0025259 | 0.0377677 |
| Racial Background | ||||||
| 2 | −0.7697772 | 0.0662507 | −11.62 | 0.000*** | −0.8996262 | −0.6399281 |
| 3 | −0.3417903 | 0.070115 | −4.87 | 0.000*** | −0.4792132 | −0.2043674 |
| 5 | −0.8136661 | 0.0538913 | −15.10 | 0.000*** | −0.9192911 | −0.7080412 |
| Connection Speed | 1.105471 | 0.2273749 | 4.86 | 0.000*** | 0.6598242 | 1.551117 |
| Country of Origin | ||||||
| 1 | 0.0929469 | 0.0568445 | 1.64 | 0.102 | −0.0184662 | 0.20436 |
| _cons | −3.814999 | 0.2644598 | −14.43 | 0.000 | −4.333331 | −3.296668 |
* For Census Region: 1 = North East, 2 = North Central, 3 = South, 4 = West. For Racial Background: 1 = Caucasian, 2 = African American, 3 = Asian, 5 = Unknown. For Country of Origin: 1 = Hispanic, 2 = Non-Hispanic.
We have also checked for multicollinearity between the variables—that is, whether the explanatory power of some of them is due to their correlation with other independent variables. One of the problems with the Best Customers data is that they did not enable us to check for multicollinearity. We found low levels of correlation between the dependent variables, which refutes the possibility of multicollinearity. The correlations between almost all of the independent variables are around 0.1 or lower—except for the correlation between income and education, which scored 0.379, representing some degree of correlation but not a strong correlation.
|
|
Most Education Head of Household |
Census Region |
Household Size |
Oldest Age Head of Household |
Household Income |
Racial Background |
Country of Origin |
|---|---|---|---|---|---|---|---|
|
Most Education Head of Household |
1.000 |
|
|
|
|
|
|
|
Census Region |
0.0562 |
1.000 |
|
|
|
|
|
|
Household Size |
−0.0265 |
−0.0101 |
1.000 |
|
|
|
|
|
Oldest Age Head of Household |
0.0369 |
−0.0169 |
−0.0887 |
1.000 |
|
|
|
|
Household Income |
0.3796 |
−0.0195 |
0.1130 |
0.0160 |
1.000 |
|
|
|
Racial Background |
−0.0357 |
0.0871 |
0.0594 |
−0.0949 |
−0.0436 |
1.000 |
|
|
Country of Origin |
−0.0676 |
0.0660 |
0.0639 |
−0.0425 |
−0.0510 |
0.1768 |
1.000 |
III. Discussion of Results
Some of our findings, such as the lower expectancy of southerners to buy protected video and audio material and the lower expectancy of lower-income households to buy such material, reinforce the limited data from the Best Customers survey.
The four statistically significant parameters enable us to define a cohort that does not consume any of the copyrighted material we discuss in this Essay. In the case of audio, out of the cohort of southern households (Census Region = 3) in which the head of the household has no college degree (Most Education—Head of Household ≤ 2) and is twenty-four years old or younger (Oldest Age Head of Household ≤ 2), and in which household income is less than $100,000 (Household Income ≤ 15) and the racial background is not African American (Racial Background ≠ 3)—a cohort of 176 households—not one household purchased any copyrighted audio content online in 2016.
In the case of video, in the cohort of southern households with incomes of less than $100,000 (Household Income ≤ 15) and in which the head of household did not attend college (Most Education—Head of Household ≤ 1), is twenty-nine years old or younger (Oldest Age Head of Household ≤ 3), and whose racial background is not African American (Racial Background ≠ 3)—a cohort of seventy-two households—not one household purchased any copyrighted video content online in 2016. While this cohort is smaller than the one defined for nonconsumption of audio, its greater divergence from the mean of purchasing households, which was more than double that of audio (over 4 percent in comparison to over 2 percent), compensates for its smaller size.
If these findings could have been extended to other forms of purchases and actually reflected the total consumption of copyrighted content, a legal regime that reduced the liability of members of such households for copyright infringements—and even granted them complete immunity—would seem likely to have no effect on authors’ incentives to create. The expectation that such households would purchase copyrighted material is close to zero, and thus exempting them from liability would increase the welfare of these defined cohorts without adversely affecting the remuneration of authors.
An important question that arises from the analysis of the data is: What should actually be measured, purchases or consumption? Analysis of purchases provides information regarding the households’ actual willingness to pay. Yet some may argue that purchases are not necessarily the only relevant parameter. Rather, the relevant parameter may be valuation of the product, which is distinct from willingness to pay. There may be some households that attribute high value to the consumption of copyrighted material but do not attribute high value to consuming this content legally. Even though they attribute high value to the consumption of content, they may not purchase it because they can download it illegally. Such households are potential customers of creators of content and would start paying if an effective enforcement mechanism were to arise. Thus, in order to fully estimate the potential customers of copyrighted content, one has to collect data regarding all forms of consumption of the product and not only purchases. How these data should be analyzed in order to deduce valuation from consumption is a separate issue that should be addressed when the data are available.
It is not necessarily true that consumption data are irrelevant for the purpose of personalizing copyright law. From the point of view of owners of protected content, what matters is the actual purchases, not why one does not purchase—whether because of low valuation of the product or low valuation of legal consumption. It is true that, if the latter is correct, enhanced enforcement may increase the number of purchasing households. Yet our Essay is focused on personalization of copyright assuming that enforcement level is fixed.
Furthermore, it is possible to argue that the phenomenon of illegal consumption supports the adoption of personalized copyright law. If the demand for copyrighted material is relatively inelastic for certain households, and they would consume approximately the same level of copyrighted content legally or illegally, social welfare may increase by transforming the consumption of such households into legal forms of consumption. Illegal behavior constitutes a per se cost besides the social cost of the consequences of the illegal behavior. As Professor Robert Cooter has noted, “Internalizing a social norm is a moral commitment that attaches a psychological penalty to a forbidden act.”47 Once an individual transgresses the law in one field and incurs the cost of being a transgressor, one is more likely to transgress the law in other fields—even if prior to that act, the individual would not have made these additional transgressions—because the first transgression reduces the marginal cost of the next.48
IV. Implications for Legal Policy
The availability of personalized consumption data has the potential to transform copyright law in three different ways: First, it will reduce the deadweight loss associated with copyright protection. Second, it calls for the adoption of differential statutory damages categories that take into account users’ propensities to pay for copyrighted content. Finally, it provides a prima facie case for exempting users with certain characteristics from copyright liability. We discuss these implications in order.
A. Deadweight Loss
It is a well-established result in the economic literature that copyright protection cannot yield a first-best result.49 Copyright law incentivizes creativity by conferring legal exclusivity on authors. That same exclusivity allows creators to engage in supracompetitive pricing. Copyright protection, therefore, invariably gives rise to a deadweight loss, represented by the loss of those users who would have purchased the content at the competitive price but not at the supracompetitive price.50 Naturally, in a world with perfect information, copyright owners—indeed, all monopolists—would prefer to adopt a differential pricing scheme that allows them fully to extract the surplus of users.51
Alas, copyright owners were unable until recently to figure out users’ reserve prices. The availability of personalized data about consumers allows copyright owners to offer content at different prices to members of different groups. Actually, many of them are already taking advantage of this possibility. From a policy perspective, this dynamic has the salutary effect of diminishing the deadweight loss associated with copyright protection. The reduction in this deadweight loss should come as welcome news to both authors and users. Authors, for their part, will see greater rewards for their creative efforts. And more users will gain access to copyrighted content.
It should be noted that personalization may also generate a deadweight loss. A personalized regime may generate a cost for an individual who wants an attribute on which the personalization is based. For example, an individual may want to move from the southern United States to the Northeast. As a consequence of the personalization of copyright protection based on one’s domicile, changing one’s residence might increase the price that one is charged for copyrighted content. This, in turn, might distort one’s decision about where to live. The distortion could also work in the opposite direction: a person whose preference is to live in the Northeast may choose to live in the South in order to decrease her expenses on consumption of copyrighted goods. While it is true, in principle, that a personalized copyright may not only eliminate a deadweight loss but also generate another, it seems that the deadweight it eliminates is much greater than the one it generates. First, personalization can also be based on parameters that the individual cannot alter, such as age, height, or ethnicity, and thus personalization will have no distortionary effect. Second, it is highly unlikely that the distortionary effect of personalization will be significant. The amount a household can save by reducing expenses on copyrighted content is negligible: as noted in the Best Customers Index, the average household spends $6.70 annually on audio copyrighted material.52 It is doubtful that this amount would cause any significant changes in an individual’s behavior. Changing one’s domicile in order to lower this amount would be highly irrational. The potential cost savings that can be realized by moving will be dwarfed by the moving costs. Therefore, it seems safe to assume that the social gains from the reduction of the deadweight loss of copyright protection via the creation of a personalized copyright regime would dominate the effect of enhancing a tax-like deadweight loss by distorting individuals’ behavior.
B. Statutory Damages
The Copyright Act of 197653 provides copyright owners with a wide array of remedies, including statutory damages.54 Statutory damages have proven to be an especially popular remedy, as the actual harm suffered by copyright owners from various infringements is often very hard to prove and quantify.55 It is unsurprising, therefore, that statutory damages are the remedy of choice for many copyright owners.56 Section 504(c) of the Copyright Act empowers owners to receive statutory damages that range between $750 and $30,000 for standard infringements.57
At present, and this has always been the case historically, statutory damages are never adjusted based on user characteristics. In the past, doing so was not even an option, as information about the consumption patterns of users did not exist. Our analysis suggests that, in the future, it may be possible—indeed, desirable—to vary statutory damages awards based on the personal characteristics of infringers. As we suggest, users with certain characteristics are highly unlikely to purchase copyrighted content. If such individuals are sued for infringement, the damages imposed on them should reflect the fact that their infractions do not represent lost sales. New categories of lower statutory damages should be adopted, or at a minimum, courts and juries ought to adjust the awards granted under the present scheme against users from the groups we identify.
Relatedly, the type of copyrighted work involved in the infringement action must also be taken into account. Our analysis reveals that users’ consumption patterns vary among categories of works. Individuals with certain characteristics may abstain from consuming a particular type of copyrighted works, say audio, and at the same time engage in heavy consumption of another category of protected content, say video.
It may also be advisable to distinguish among consumer profiles of different genres of music and movies. Our data reveal that, among the purchasers of copyrighted content, there are certain cohorts whose expectancy of purchasing a particular genre may be close to zero. For example, consumers who are willing to pay for hip-hop music may abstain from buying country music (and vice versa). In determining statutory damages, courts ought to be mindful of this possibility.
Aside from the general welfare argument for personalizing copyright infringement penalties, personalization according to genres may serve an additional purpose that some scholars believe is of high social value: enhancement of cultural diversity.58 Enabling individuals to freely consume genres to which they would never have been exposed benefits all parties involved.
C. Exempting Certain Users from Copyright Liability
The most extreme version of a personalized copyright regime would grant full immunity from copyright liability to cohorts with an especially low propensity to purchase copyrighted content. Individuals within the cohort would be allowed to engage in private consumption of copyrighted content free of risk and free of charge as long as they do not share the content with other individuals. While such a legal regime may appear extreme, it is not unprecedented: in some legal systems, private usage, including even copying copyrighted material for private purposes, is permitted across the board.59 Our proposal is more moderate: permitting private use by members of certain cohorts. If the expectancy of purchases by members of a certain cohort is close to zero, permitting these individuals to consume the copyrighted content would inflict only a minimal harm on copyright owners and would only slightly diminish their incentive to create.
A full immunity scheme has one central advantage over the alternative of reduced statutory damages. Both options aim at enabling wider use of copyrighted content by cohorts with low propensity to purchase. Yet the latter approach does so by increasing the prevalence of an illegal activity: it decreases the cost of violating copyright law, but the nonpurchasing cohorts consuming copyright freely are still violating copyright law. Increasing copyright consumption by increasing the economic incentive to violate copyright law generates the additional social costs associated with violating the law detailed above. The former does not raise this problem. It does not increase copyright consumption of the nonpurchasing cohorts by increasing their economic incentive to violate the law. It excludes the legal limitations of copyright from applying to such cohorts from the start and excludes them from being legally defined as violators.
Yet the deferential penalty treatment may better suit cases in which the propensity of certain cohorts is low but not close to zero. In such cases, permitting the cohort to consume the copyright freely would damage the copyright. In contrast, lowering the effective sanction may function as a self-selection device, enabling individuals who would not otherwise purchase the copyright to consume it.
V. The Limits of Market-Based Personalization
Theoretically, copyright owners can lower the price charged to almost zero for individuals who put a very low value on the use of copyrighted content and would not have used the content otherwise. This raises the question: If private actors have access to big data and can engage in price differentiation, why adopt a personalized copyright regime? One may argue that legal intervention is unwarranted in this case because the market will induce copyright owners to harness big data in order to engage in personalized pricing.
There are several problems with this argument. First, the motivation of copyright owners to expend resources to capture low-value users critically depends on the legal regime that applies to the owners and defines the scope of their rights. Extant copyright law allows copyright owners to seek statutory damages between $750 to $30,000 for standard infringements60 and increases the amount to up to $150,000 for willful infringements.61 These are significant amounts. Instead of engaging in price discrimination that would enable them to capture the surplus of low-value users, copyright owners are likely to find it in their interests to allow low-value users to breach and then sue for statutory damages. The availability of statutory damages under current law, therefore, changes the calculus of copyright owners. Against the current legal background, copyright owners will likely be better off if they forgo the opportunity to devise a comprehensive individualized pricing scheme and adopt instead a strategy of selective enforcement.62 It should be borne in mind that, under the existing copyright system, inframarginal users are not exempt from liability. Collecting statutory damages even from a relatively small percentage of inframarginal users is likely to be more cost-effective for most copyright owners than incurring the cost of offering them low prices, although it would clearly be less fair.
Second, irrespective of the applicable legal regime, cost constraints may prevent copyright owners from reaching out to low-value users. The graph below, in Figure 1, exemplifies this possibility through designating the demand curve for a certain copyrighted content. Without price discrimination, copyright owners would set the price at the monopoly price, designated Pmon. The owners’ surplus would be the square area marked with horizontal lines, and the consumers’ surplus would be the area above that marked with vertical lines. When copyright owners shift to price discrimination, they add to their surplus the two areas marked with vertical lines. But price discrimination is cost-justifiable only to a certain point, designated Pmin. Beyond this point, it is not cost-effective for copyright owners to continue to expend resources on price discrimination even though theoretically they could also add to their surplus the area marked in black. This is due, of course, to the cost associated with the practice of price discrimination. Price discrimination requires acquiring data and analyzing it. Naturally, the acquisition of data can be rather costly. For the group of individuals comprising the black-tailed area, it might not be worthwhile to acquire data regarding their willingness to pay. The expected price the copyright owners can obtain from this group of individuals is lower than the cost of obtaining data regarding each individual’s willingness to pay. Hence, the copyright owners would abstain from price discriminating within that group altogether.
Figure 1: Price Discrimination among Copyright Owners
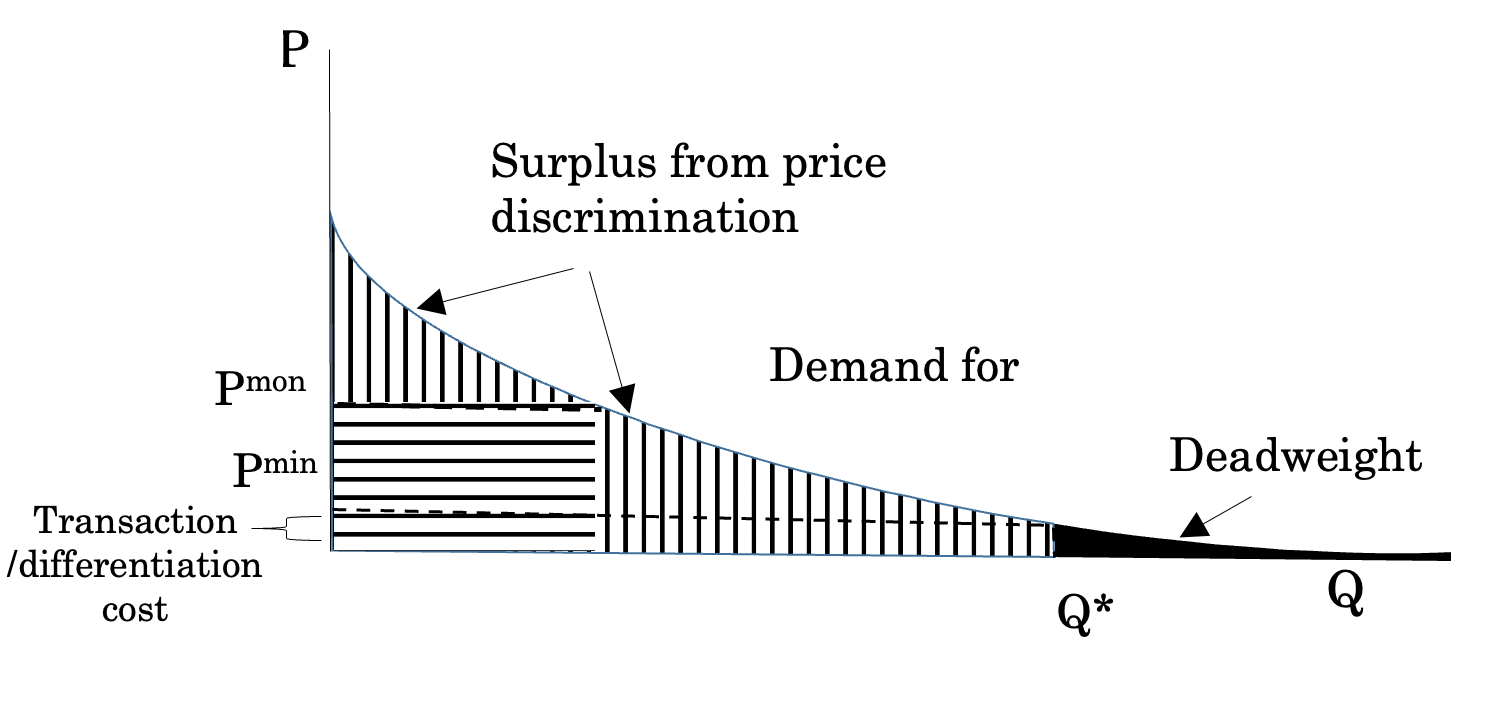
Because of the low amount that copyright owners can charge to the individuals comprising the black-tailed area, the transaction costs may exceed the expected price, making it unprofitable for the owners to sell users the right to use the copyrighted material in a market transaction. As a result, market-based price discrimination would reduce the deadweight loss associated with copyright protection, but not within the black-tailed area: it would bar those individuals from consuming the copyrighted material even though their consumption would have generated a net surplus equivalent to the area of the black-tailed area. A personalized copyright regime internalizes this welfare loss that private actors do not internalize. Hence, a personalized copyright regime can eradicate the deadweight loss of copyright that market-based personalization leaves intact.63
Conclusion
In this Essay, we laid out the case for adopting a personalized copyright regime in which the penalties for copyright infringement would be lowered for cohorts with a low propensity to purchase copyrighted content. Big data has already transformed the ways in which copyrighted material is created.64 We argue that it should also transform the way copyright is protected in order to enhance social welfare. It is time for copyright law to join other legal fields, such as contracts65 and torts,66 in which scholars have argued that big data enables reforms and personalization of the legal standards in those fields, thereby enhancing efficiency.
The logic of the argument in this Essay could apply to the consumption of public goods in general and, more specifically, to the field of taxation. The central attribute that enables the application of our argument to copyright is that additional consumption does not impose any additional costs on the manufacturers of the resources consumed (that is, copyrighted content). This is true also in the case of classic public goods, which have a central characteristic of being nonrival—that is, consumption of the resource by one individual does not preclude other individuals from consuming the resource.67 It is possible to utilize big data to price discriminate between individuals consuming public goods in order to reach an optimal level of consumption of those public goods. This suggestion is not far from one of the major justifications for progressive taxation: the benefit principle.68 According to the benefit principle, one’s payment for public goods should be in proportion to the benefit or utility one derives from the existence of the public good.69 In this sense, levels of income serve as a proxy for the degree of benefit people derive from public goods.70 According to such logic, in an era of big data, there may be less reason to settle for such a rough proxy for the level of benefit: the tax system can use much more sophisticated parameters than income to measure the level of benefit that one derives from public goods, and maybe even use those parameters to measure the level of benefit that one derives from the music that one purchases.
- 1See William M. Landes and Richard A. Posner, An Economic Analysis of Copyright Law, 18 J Legal Stud 325, 326 (1989).
We would like to thank Oren Bar-Gill, Omri Ben-Shahar, Niva Elkin-Koren, Michal Gal, Ariel Porat, Peter Siegelman, Lior J. Strahilevitz, the participants of The University of Chicago Law Review Symposium on Personalized Law, and the editors of The University of Chicago Law Review for their thorough editing. We would like to especially thank Daniel Hemel, the commentator of our paper, for his numerous valuable comments.
- 2See Gideon Parchomovsky and Peter Siegelman, Towards an Integrated Theory of Intellectual Property, 88 Va L Rev 1455, 1466 n 42 (2002).
- 3See 17 USC § 504. See also Landes and Posner, 18 J Legal Stud at 328–29 (cited in note 1) (discussing the market dynamics between the author’s assumption of copyright protection for her work and the disincentive created by the potential that the work will be copied without authorization).
- 4Abraham Bell and Gideon Parchomovsky, Reinventing Copyright and Patent, 113 Mich L Rev 231, 255–59 (2014).
- 5See Table 1110. Deciles of Income before Taxes: Annual Expenditure Means, Shares, Standard Errors, and Coefficients of Variation, Consumer Expenditure Survey, 2016 (Bureau of Labor Statistics, Aug 2017), archived at http://perma.cc/S5BK-9KAU.
- 6See Joel Waldfogel, First Degree Price Discrimination Goes to School, 63 J Indust Econ 569, 569 (2015) (“Person-specific pricing, also known as ‘first-degree price discrimination,’ is discussed in essentially every microeconomics textbook and class, but it is normally invoked more as an intellectual benchmark than as an example of real-world pricing.”). The economist Arthur Pigou has termed user-specific pricing “discrimination of the first degree.” See A.C. Pigou, The Economics of Welfare 278–80 (Macmillan 4th ed 1932).
- 7Nielsen Music Year-End Report, U.S. 2016 *3 (Nielsen, Jan 9, 2017), archived at http://perma.cc/KED8-2G7E.
- 8Id.
- 9Id at *6.
- 10For the First Time, More than Half of Americans Will Watch Streaming TV (eMarketer, Feb 3, 2016), archived at http://perma.cc/GNF7-6HBU.
- 11Id.
- 12Video 360° 2017 Report Highlights *2 (Nielsen, Aug 24, 2017), archived at http://perma.cc/7VWG-9E2A.
- 13Audience Analytics (ComScore, 2018), archived at http://perma.cc/5HU3-ANAN.
- 14Quantcast Audience Grid: The Open Data Platform for Digital Advertising (Quantcast, 2018), archived at http://perma.cc/BR4F-ZFX8.
- 15Research Studies (MusicWatch, 2018), archived at http://perma.cc/VRJ3-ZDP4.
- 16TellApart, acquired by Twitter in 2015, used commerce data to help companies personalize their advertisement campaigns. See Twitter to Acquire TellApart (Twitter, 2018), archived at http://perma.cc/P94D-NQFS. For information regarding a business providing similar services that TellApart took over—Freshplum—and other competitors, see Adam Tanner, Different Customers, Different Prices, Thanks to Big Data (Forbes, Mar 26, 2014), archived at http://perma.cc/UW5W-WQS6.
- 17For example, the cost of ComScore panel data for one year, which is the data analyzed in this Essay, is $20,000 even for academic institutions. The same panel data for a range of a few years can reach $100,000, and this is relatively cheap compared to more expensive behavioral data ComScore offers regarding users’ browsing activity and not only their purchasing behavior.
- 18Consumption Analysis (ComScore, Apr 18, 2018), online at http://wrds-web.wharton.upenn.edu/wrds (Perma archive unavailable) (visited Dec 31, 2018).
- 19Table 1110, Consumer Expenditure Survey, 2016 (cited in note 5).
- 20New Strategist Publications, ed, Best Customers: Demographics of Consumer Demand 146 (New Strategist 9th ed 2012).
- 21Id.
- 22Id.
- 23Id at 3.
- 24New Strategist, ed, Best Customers at 146 (cited in note 20).
- 25Id at 147.
- 26Id.
- 27Id.
- 28New Strategist, ed, Best Customers at 147 (cited in note 20).
- 29Id.
- 30Id.
- 31Id.
- 32New Strategist, ed, Best Customers at 147 (cited in note 20).
- 33We have not been able to obtain the full data set on which the analysis of the Best Customers Index relies. The data available online from the Bureau of Labor Statistics have only a general category for entertainment and do not split it into its components. See Table 1110: Consumer Expenditure Survey, 2016 (cited in note 5). As a result, we are not able to determine at this stage the interdependence of these factors, and thus we are unable to determine the exact probability that such a household would spend resources on this category. Nonetheless, the data regarding expenses on streaming and downloading video content expose that the correlation between the categories is not very strong. The relationship between the categories is fairly different in the two cases, negating the possibility of strong interdependence.
- 34New Strategist, ed, Best Customers at 149 (cited in note 20).
- 35Id at 147, 149.
- 36Id at 149.
- 37Id at 147, 149.
- 38New Strategist, ed, Best Customers at 149 (cited in note 20).
- 39See text accompanying note 30.
- 40New Strategist, ed, Best Customers at 146–47 (cited in note 20).
- 41ComScore Media Metrix Description of Methodology *3 (ComScore, Nov 2013), archived at http://perma.cc/P3T4-U3XZ.
- 42Id at *4.
- 43Id.
- 44Id.
- 45ComScore Methodology at *3 (cited in note 41). Yet even if perfectly weighted, this data set faces serious methodological limitations due to the selection biases of the individuals willing to share their browsing activity. This is especially relevant with respect to the household income variable: even if the panel includes high-income households, it is questionable whether these households actually reflect the typical behavior of high-income households. The fact that they are willing to expose to third parties their browsing activity in exchange for some form of benefit reflects, to some extent, that their resources are limited. Otherwise they could have purchased an equivalent benefit without exposing their browsing behavior to third parties.
- 46There were no other categories useful for our purposes. ComScore does not have a category for streaming services—it does have a category of online content sales and online service subscriptions, but it does not include streaming services like Netflix for video and Spotify for audio. The reason for this is that, for such services, a one-time purchase is sufficient to consume the service for a long period of time, and thus reviewing the purchases made online will not effectively capture these forms of consumption.
- 47Robert Cooter, Expressive Law and Economics, 27 J Legal Stud 585, 586 (1998). For a discussion of the phenomenon of “self-concept maintenance” and its relevance to the legal field, see Yuval Feldman, Behavioral Ethics Meets Behavioral Law and Economics, in Eyal Zamir and Doron Teichman, eds, The Oxford Handbook of Behavioral Economics and the Law 213, 222–23 (Oxford 2014).
- 48This is an additional rationale for personalization of law—not different levels of benefits or direct social costs resulting from an action, but different indirect levels of social costs of the transgression per se. Certain types of individuals transgress a certain law but would not have transgressed if the legal prohibition had been limited to more severe acts, increasing the social cost of their classification as transgressors.
For example, the conventional way of applying personalized driving laws would be to differentiate between drivers who, driving at the same speed, impose different social risks. The more talented Type A drivers may impose only a 0.0001 risk of an accident when driving at sixty miles per hour, and reach a 0.001 risk level only when driving at seventy miles per hour. The less talented Type B drivers may reach the risk level of 0.001 driving at sixty miles per hour. This is the conventional setting for personalizing the law: the law would prohibit driving while imposing more than a 0.001 risk of an accident, permitting Type A drivers to drive up to a speed of seventy miles per hour and Type B drivers to drive up to a speed of sixty miles per hour.
The rationale provided above would justify personalization of law even if individuals impose the same social cost at a given speed and receive the same personal benefit from driving fast, as long as they diverged in their valuations of driving legally. For example, Type C drivers, who do not attribute so much value to driving legally as to justify barring them from the benefit of driving at eighty miles per hour if the legal speed were sixty miles per hour, may still attribute sufficient value to driving legally to keep their speed at seventy miles per hour if that were the legally permitted speed. In contrast, Type D drivers, who attribute high value to driving legally, would drive at sixty miles per hour if that were the legally permitted speed. Such situations may also justify personalization. In order to avoid the social cost of turning Type D drivers into transgressors, the legally permitted speed that would apply to them would be seventy miles per hour, while the one that would apply to Type C drivers would be sixty miles per hour.
This personalization may raise much greater fairness and equality concerns if we permit certain individuals to impose greater social risks than others. Yet it is possible to justify such personalization on fairness grounds because, in the same way progressive taxes are justified from an egalitarian perspective, they maintain equal sacrifice. Also, in this case, it can be argued that the personalized driving law maintains equal sacrifice of drivers for the sake of public safety. The subjective sacrifice that Type C drivers make for public safety is equivalent to the subjective sacrifice Type D drivers make for public safety.
- 49See, for example, Bell and Parchomovsky, 113 Mich L Rev at 240–41 (cited in note 4); Danny Ben-Shahar and Assaf Jacob, Selective Enforcement of Copyright as an Optimal Monopolistic Behavior, 3 Contributions to Econ Analysis & Pol 1, 14–18 (2004); Landes and Posner, 18 J Legal Stud at 351–52 (cited in note 1).
- 50See Bell and Parchomovsky, 113 Mich L Rev at 240–41 (cited in note 4).
- 51See id.
- 52New Strategist, ed, Best Customers at 147 (cited in note 20).
- 53Pub L No 94-553, 90 Stat 2541, codified at 17 USC § 101 et seq.
- 5417 USC § 504.
- 55Indeed, the desire to help copyright owners overcome difficult evidentiary problems is often cited as the primary justification for allowing them to collect statutory damages. See, for example, Colin Morrissey, Behind the Music: Determining the Relevant Constitutional Standard for Statutory Damages in Copyright Infringement Lawsuits, 78 Fordham L Rev 3059, 3071–72 (2010); Stephanie Berg, Remedying the Statutory Damages Remedy for Secondary Copyright Infringement Liability: Balancing Copyright and Innovation in the Digital Age, 56 J Copyright Society USA 265, 274 (2009).
- 56See Ben Depoorter, Copyright Enforcement in the Digital Age: When the Remedy Is the Wrong, 66 UCLA L Rev *7 (forthcoming 2019) (on file with authors) (reporting that “[p]laintiffs in copyright litigation request statutory damages in eight[y]-nine percent of cases”).
- 57If the infringement is willful, the amount goes up to $150,000; in the case of an innocent infringement, courts can lower the amount to $200. See 17 USC § 504(c)(2).
- 58See, for example, Bhikhu Parekh, Rethinking Multiculturalism: Cultural Diversity and Political Theory 165–78 (Harvard 2000). Some justify cultural diversity from an economic lens by referencing the positive externalities generated by cultural diversity. See, for example, Gianmarco I.P. Ottaviano and Giovanni Peri, The Economic Value of Cultural Diversity: Evidence from US Cities, 6 J Econ Geography 9, 38 (2006).
- 59For example, in Norway, copying copyrighted works for private use, such as downloading songs, is permitted. See Tarja Koskinen-Olsson, The Notion of Private Copying in Nordic Copyright Legislation in the Light of European Developments during Recent Years, 49 J Copyright Society USA 1003, 1012–13 (2002).
- 6017 USC § 504(c)(1).
- 6117 USC § 504(c)(2). Willful infringement has been defined as covering situations in which (a) “the defendant was actually aware of the infringing activity, or” (b) “the defendant’s actions were the result of ‘reckless disregard’ for, or ‘willful blindness’ to, the copyright holder’s rights.” See Island Software & Computer Service, Inc v Microsoft Corp, 413 F3d 257, 263 (2d Cir 2005).
- 62For a discussion of selective enforcement, which occurs when copyright holders enforce claims against only certain infringers, see generally Ben-Shahar and Jacob, 3 Contributions to Econ Analysis & Pol 1 (cited in note 49).
- 63There might be an additional justification for personalization of copyright, even in cases in which the inframarginal consumers attribute zero value to the copyrighted content and the black-tailed area does not exist. Under market-based personalization, if the inframarginal consumers attribute zero value to the copyrighted content, they would never consume the copyrighted material—no one would market the material to them because there is nothing to gain. In contrast, a personalized copyright regime would enable them to consume the copyrighted material at no cost. This may also seem pointless: if these individuals attribute zero value to the consumption of the copyrighted material, there is no social welfare gain even if they do consume the copyrighted material. Yet according to certain approaches that attribute positive value to cultural diversity, such consumption may still have a positive value. Without a personalized copyright regime, those groups will never be exposed to the cultural experiences involved in using the copyrighted material, and thus society as a whole suffers a lack of cultural diversity. The positive value of cultural diversity exists within the welfare economics framework, because it generates positive externalities, or as a source of value per se outside the realm of conventional welfare economics. See, for example, Heritiana Ranaivoson, Does the Consumer Value Diversity? How the Economists’ Standard Hypothesis Is Being Challenged, in Marilena Vecco, ed, The Consumption of Culture, the Culture of Consumption: A Collection of Contributions on Cultural Consumption and Cultural Markets 70, 77–79 (Lambert 2012) (discussing the sociological and psychological benefits of cultural diversity); David Throsby, The Economics of Cultural Policy 172–73 (Cambridge 2010) (listing four benefits of cultural diversity as cultural capital).
- 64See Michael D. Smith and Rahul Telang, Streaming, Sharing and Stealing: Big Data and the Future of Entertainment 3–15 (MIT 2016) (describing how Netflix changed the way in which TV series are produced, including by being willing to forgo the creation of a pilot episode, based on its big data regarding consumer preferences).
- 65See Ariel Porat and Lior Jacob Strahilevitz, Personalizing Default Rules and Disclosure with Big Data, 112 Mich L Rev 1417, 1422–33 (2014).
- 66See Omri Ben-Shahar and Ariel Porat, Personalizing Negligence Law, 91 NYU L Rev 627, 676–88 (2016).
- 67See Paul A. Samuelson, The Pure Theory of Public Expenditure, 36 Rev Econ & Statistics 387, 387 (1954).
- 68Various forms of the benefit principle and the premise that underpins it—that taxation is a price for services rendered—were expressed by various classical thinkers, such as Hobbes, Locke, Grotius, and Pufendorf. For the historical intellectual roots of the principle, see Richard A. Musgrave, The Theory of Public Finance: A Study in Public Economy 63–73 (McGraw-Hill 1959); Edwin R.A. Seligman, Progressive Taxation in Theory and Practice 79–86 (American Economic Association 1894). For its modern formulation, as it is mostly identified, see Friedrich A. Hayek, The Constitution of Liberty 315–16 (Chicago 1960).
- 69Hayek, Constitution of Liberty at 315–16 (cited in note 68).
- 70For arguments supporting the assumption that higher-income earners derive greater benefits from public goods, see Yoseph Edrey, Constitutional Review and Tax Law: An Analytic Framework, 56 Am U L Rev 1187, 1209–13 (2007); C. Eugene Steuerle, And Equal (Tax) Justice for All?, reprinted in Joseph J. Thorndike and Dennis J. Ventry Jr, eds, Tax Justice: The Ongoing Debate 253, 261–63 (Urban Institute 2002). For an example of how even a regressive tax provides more benefits to higher-income earners, see id at 268–70. But see Walter Blum and Harry Kalven Jr, The Uneasy Case for Progressive Taxation, 19 U Chi L Rev 417, 451–55 (1952).