Algorithmic Price Discrimination When Demand Is a Function of Both Preferences and (Mis)perceptions
Sellers are increasingly utilizing big data and sophisticated algorithms to price discriminate among customers. Indeed, we are approaching a world in which each consumer will be charged a personalized price for a personalized product or service. Is this type of price discrimination good or bad? The normative assessment, I argue, depends on the target of the discrimination. Sellers are interested in the consumer’s willingness to pay (WTP) for their goods or services: they maximize profits by charging a price that is as close as possible to the consumer’s WTP. This WTP is a function of consumer preferences on the one hand and consumer (mis)perceptions on the other hand. When algorithmic price discrimination targets preferences, it harms consumers but increases efficiency. When price discrimination targets misperceptions, specifically demand-inflating misperceptions, it hurts consumers even more and might also reduce efficiency. In such cases, legal intervention may be needed. In particular, when sellers use personalized pricing, regulators should fight fire with fire and seriously explore the potential of personalized law.
Introduction
To maximize profits, sellers like to engage in price discrimination—to set higher prices for consumers who are willing to pay more and lower prices for consumers who are willing to pay less. In the past, such price discrimination was limited to coarse categories, for example, setting higher prices for business travelers and lower prices for leisure travelers. No longer. Fueled by big data, algorithmic price discrimination enables sellers to parse the population of potential customers into finer and finer subcategories—each matched with a different price. In some cases, sellers are even able to set personalized pricing, marching down the demand curve and setting a different price for each consumer.1
Uber, Amazon, Staples, and the online video game store Steam were found to vary price by geographic location and, in Uber’s case, also by the time of day.2 B&Q, a British multinational company, tested in its brick-and-mortar stores digital price tags that interfaced with customers’ phones and adjusted the displayed price based on the customer’s loyalty cards data and spending habits.3 Grocery stores are experimenting with digitized and personalized pricing using e-coupons.4 Allstate was criticized for optimizing prices based on its calculated likelihood that individual users would comparison shop before purchasing insurance.5 A recent study found that many retailers and travel sites set personalized prices that vary by hundreds of dollars from one consumer to the next.6 Indeed, new players, intermediaries, have appeared with the express purpose of identifying consumers’ willingness to pay (WTP) and selling this information to retailers that then use it to price discriminate.7
Price discrimination is based on the ability to identify the consumer’s WTP. Indeed, the concept of WTP is central to any discussion of price discrimination. And yet the richness and subtlety of this concept has not been fully recognized. Standard accounts of price discrimination assume, often implicitly, that a consumer’s WTP is derived entirely from that consumer’s preferences (and budget constraints). For example, some consumers are willing to pay more for a health club membership because they enjoy a greater benefit from the membership. These consumers may be entertainers whose careers depend on a well-sculpted body, or they may enjoy a direct benefit from working out, or they may enjoy the status that comes with membership in a prestigious health club. Other consumers have different preferences—they enjoy a smaller benefit from a health club membership and thus are willing to pay less for it. WTP, in the standard model, is all about preferences.8
This view of WTP, I argue, is too narrow. In addition to preferences, a consumer’s WTP is affected by the consumer’s perceptions or misperceptions.9 Consider, again, the health club example. Assume that Consumer A and Consumer B hold identical preferences and enjoy an identical benefit—which can be based on health, aesthetics, or status—from attending the health club. Further assume that both A and B will attend the club no more than once a month, which inevitably limits the benefit that they gain from membership. Yet while A realizes that she will attend the club no more than once a month, B falsely believes that he will attend at least once a week and thus overestimates the benefit from membership. This misperception will have a substantial effect on B’s WTP; he would be willing to pay more for the health club membership than A would. Even consumers with identical preferences (and budget constraints) may have very different WTP measures. WTP is a function of both preferences and (mis)perceptions. Sellers use big data and sophisticated algorithms to identify and measure both of these factors so that they can set a personalized price equal to the consumer’s full, though misguided, WTP.
A more complete understanding of WTP as a product of both preferences and (mis)perceptions has significant positive and normative implications. In the standard model, in which WTP reflects only preferences, price discrimination harms consumers but increases efficiency. Consumers are harmed because the seller—a monopolist or any seller with sufficient market power to engage in price discrimination—extracts the entire surplus by setting a price that is just below each consumer’s WTP. Efficiency is increased because price discrimination eliminates the monopoly deadweight loss. The overall welfare assessment depends on the relative weights of efficiency and distribution in the social objective function10 (unless the adverse distributional implications can be neutralized through an appropriate adjustment to the tax and transfer system11 ).
When WTP reflects both preferences and misperceptions, specifically demand-inflating misperceptions, price discrimination hurts consumers even more and might also reduce efficiency. The harm to consumers increases because consumers pay a price that is equal to their perceived benefit, which exceeds their actual benefit. While, in the standard model, consumers are left with no gain, here consumers suffer an actual loss. Efficiency is also compromised because price discrimination combined with overestimation leads marginal consumers to purchase products when the cost of production exceeds the actual benefit (but not the higher, perceived benefit). With a larger distributional cost and a smaller efficiency benefit, or even an efficiency cost, the case for legal intervention becomes much stronger.12
These results are established using a graph-based economic analysis. Starting with the neoclassical model, in which WTP is derived from preferences alone, I replicate standard results about the effects of price discrimination on consumer surplus and on overall efficiency. I then turn to the main contribution of this Essay: I develop a behavioral model in which WTP is derived from both preferences and misperceptions. In this model, the actual demand curve is supplemented by a perceived demand curve. Specifically, I study the implications of an overestimation bias that pushes the perceived demand curve above the actual demand curve. (I argue that a demand-inflating overestimation bias is more likely in this context; the implications of underestimation are explored in the Appendix.) I show that the overestimation bias can substantially increase the welfare costs of algorithmic price discrimination.13
While this Essay focuses on the costs of big data and the algorithms that utilize these data, it is important to emphasize that algorithms wielding big data also produce substantial benefits. They allow for more precise matching between consumers and the products and services that these consumers need or want. The online ads that are relevant for one consumer would be annoying spam for another. Of course, matching is efficient only when the consumer is offered a product that she really needs or wants (preferences), not when she is offered a product that she mistakenly thinks she needs or wants (misperceptions).14 Big data and sophisticated algorithms can also prevent inefficient cross-subsidization. For example, in the consumer credit market, the seller’s cost depends on the individual consumer’s creditworthiness. In such markets, big data enables a different type of personalized pricing: pricing that tracks the seller’s cost rather than the consumer’s WTP. This form of price discrimination is much less objectionable and, in fact, is likely to increase efficiency and help consumers.15 Finally, it is important to remember that big data and algorithms also bring us price comparison sites and apps, which work against price discrimination.
Because price discrimination is more harmful with misperception, we should consider policies that curb price discrimination (even if we were uncertain about such policies in a world without misperception). Policymakers can target the foundation of algorithmic price discrimination: big data. Because algorithmic price discrimination is fueled by big data, this extreme form of price discrimination can be curbed by limiting sellers’ access to information about consumers’ WTP. This Essay thus provides a new argument for increased privacy protections and enhanced data security measures. But attacking the big data foundation of price discrimination runs the risk of throwing the baby out with the bathwater. Given the benefits that personalization provides, cutting the flow of information might be a net loss for consumers.
Personalized law suggests a more promising set of responses. Demand-inflating misperceptions result in high prices. A standard response is to impose price caps.16 But standard price caps are homogeneous, a single cap for the entire market, whereas price discrimination results in prices that are too high but also heterogeneous. If a single cap doesn’t work, how about multiple, personalized price caps? If sellers use personalized pricing, then regulators can respond with personalized price caps.17 The personalized cap could track the misperception and thus undo its effects. Another, softer approach uses the common disclosure technique, but with a new twist. In a world of personalized pricing—the world of price discrimination—disclosure mandates should also be personalized.18 Namely, sellers should be made to provide each consumer with individualized information on the benefit that the particular consumer stands to gain from the product. With such information, consumers will be able to separate out the misperception-based component of their WTP and avoid overpaying for the product or service.
A final comment on the domain of analysis: While this Essay focuses on price discrimination in consumer markets, a similar phenomenon occurs in labor markets. Employers are increasingly using big data and sophisticated algorithms to set personalized wages just above the individual employee’s willingness to accept (WTA).19 Here too the problem can become more severe when we look beyond the standard, preference-based model and recognize that WTA is a product of both preferences and (mis)perceptions.
The remainder of this Essay is organized as follows: Part I sets the stage. Part I.A documents the rise of personalized pricing, fueled by the big data revolution. Part I.B turns to WTP as the main target of algorithmic price discrimination. It demonstrates that misperception constitutes an important component of WTP and offers evidence on the prevalence of misperception in consumer markets and, specifically, on misperception as the target of price discrimination. Part II is the analytical heart of the Essay. It derives the positive and normative implications of price discrimination when WTP is the product of both preferences and misperceptions. Part III discusses policy implications. The Appendix considers two extensions: the first introduces a positive or negative correlation between preferences and misperceptions, and the second studies demand-deflating misperceptions.
I. Personalized Pricing, WTP, and Consumer Misperceptions
Part I motivates the analysis of price discrimination by documenting the rise of personalized pricing in the big data era. It also takes a closer look at consumers’ WTP—the key piece of information that sellers need in order to price discriminate—and distinguishes between preferences and perceptions, or misperceptions, as components of the WTP.
A. Big Data and the Rise of Personalized Pricing
Sellers can make more money when they set higher prices for consumers who are able and willing to pay more. Big data and sophisticated algorithms allow sellers to do just that—to set personalized prices. Many sellers collect, or purchase, reams of data about existing and potential customers.20 And a growing number of sellers, across multiple markets, are making use of data analytics to identify consumers’ WTP and to adjust pricing based on the individual consumer’s WTP.21
Sellers price discriminate based on several types of information, including consumers’ location, the time of day, the characteristics of their computer (for example, operating system and browser), and their purchase history.22 Sellers can collect this information themselves or purchase it from data brokers. Professor Aniko Hannak and her co-authors analyzed real-world data from three hundred consumers who visited sixteen e-commerce websites, and found “evidence of personalization on four general retailers and five travel sites, including cases where sites altered prices by hundreds of dollars.”23
Evidence suggests that a consumer’s geographic location affects sellers’ pricing decisions. For example, Uber collects rich geographic data about its customers and uses it to price discriminate.24 Also, Amazon, Staples, and the video game store Steam were found to vary price by geographic location, in extreme cases by up to as much as 166 percent.25 Uber reportedly uses time and location to price discriminate, calculating a rider’s WTP for a particular route at a certain time of day and adjusting prices accordingly.26 Characteristics of the consumer’s computer, tablet or smartphone have also been shown to trigger differential pricing. For example, one study found that Apple iOS and Safari users are occasionally shown higher prices for the same product.27 Sophisticated algorithms have identified correlations between these (and other) factors and consumers’ WTP, and they use these correlations to guide sellers’ pricing strategies.
Perhaps most useful for the price-discriminating seller is a consumer’s purchase history. Purchase history, and even browsing history, on the seller’s website or on other e-commerce sites is an obvious source of WTP information for pricing algorithms.28 B&Q, a British multinational company, tested in its brick-and-mortar stores digital price tags that interfaced with customers’ phones and adjusted the displayed price based on the customer’s loyalty card data and spending habits.29 Grocery stores are personalizing pricing using digital coupons.30 And Allstate was criticized for optimizing prices based on its calculated likelihood that individual users would comparison shop before purchasing insurance.31 Such examples of personalized pricing are becoming increasingly prevalent.
Indeed, new players, intermediaries, have appeared with the express purpose of identifying consumers’ WTP and selling this valuable information to retailers. For example, a start-up company, Optimal Decisions Group, conducted research on consumers’ WTP and sold this research, together with profit-maximizing pricing models, to insurers.32 Another start-up, Freshplum, developed algorithms that are able to predict which customers will buy only if given a discount and sold this targeted-discounts information to e-commerce vendors.33 And TellApart, which had operated in the music industry, collected consumer data and advised sellers on how to personalize their pricing schemes.34
While algorithmic price discrimination is clearly on the rise, it is important to recognize several important limits to such personalized pricing. The first is arbitrage. When a consumer with a low WTP can turn around and resell the product to a consumer with a high WTP, price discrimination becomes more difficult.35 Personalized pricing is, therefore, more likely to occur in markets in which arbitrage opportunities are limited, such as services markets, markets for perishable goods, and markets in which high transaction costs (including search costs) make arbitrage difficult.36 A second limit on personalized pricing is fairness. A consumer who learns that she paid much more than another consumer for the exact same product would feel wronged, and such outrage is bad for business.37 Personalized pricing is more likely to occur in markets in which consumers do not have direct information about how much other consumers are paying and in markets in which differential pricing is coupled with heterogeneous products such that comparisons between consumers become difficult.38
B. WTP: Between Preferences and (Mis)Perceptions
We have seen that sellers increasingly collect and utilize big data and sophisticated algorithms to identify consumers’ WTP and set personalized prices equal or close to the individual consumer’s WTP. But what exactly is WTP? What does it comprise? What determines the maximum price that a consumer is willing to pay for a product or service? In the standard, neoclassical model, WTP is derived from the consumer’s preferences. Preferences are heterogeneous. Some consumers gain a large benefit from a certain product and are thus willing to pay more for that product. Other consumers gain a smaller benefit and are willing to pay less for the same product. Consider a high-end steak dinner. Some consumers really love steak and are willing to pay a lot for the dinner. Other consumers enjoy steak but equally enjoy a much cheaper burger. These consumers would be willing to pay less for the steak dinner. And a third group of vegetarian consumers have a WTP of zero. (The consumer’s budget constraint also plays an important role in determining her WTP. But because the budget constraint plays an equally important role in the behavioral model described below, it is not emphasized here.)39
The standard, preference-based theory of WTP is clearly right and clearly incomplete. Preferences surely affect WTP, but other forces have an equally important, and sometimes more important, role in determining a consumer’s WTP. In particular, a behavioral model of WTP recognizes that perceptions and misperceptions substantially affect a consumer’s WTP. Reconsider our steak dinner. In addition to preferences for steak, consumers’ WTP can be affected by their perceptions about the benefits and risks from eating steak. For example, is the steak organic or not? Does it come from grass-fed or grain-fed cows? Is it free of antibiotics and hormones? How were the cows treated before they were slaughtered? At least some consumers would be interested in the answers to these questions, and their beliefs about the answers will affect their WTP. Moreover, for some (many?) consumers these beliefs will be false. They might think that their steak comes from a grass-fed cow when, in fact, it doesn’t. Or they might think that “organic” means one thing when, in fact, it means something else.40 Perceptions, and misperceptions, clearly affect WTP.
WTP is also affected by perceptions, and misperceptions, about the price charged. Especially when price is contingent and multidimensional, consumers might underestimate the total price that they will end up paying for the product or service. Consider a credit card with an annual fee of $50 and a late fee of $25. The consumer’s true WTP, based on the benefit that this consumer obtains from using the credit card, is, say, $60. Assume that this consumer will be late twice and, thus, pay $50 in late fees. The total price for this consumer is $100 (the $50 annual fee plus $50 in late fees). And so, with accurate perceptions, the consumer will not get the credit card. But what if the consumer optimistically thinks that she will never be late? This misperception transforms the total price of $100 into a perceived total price of $50, and the consumer will get the card. The misperception operates on the price and not directly on the consumer’s WTP. But the effect is the same. The misperception increases the de facto WTP by $50.
Misperceptions that affect consumers’ WTP are quite common. They have been documented across multiple consumer markets. Consumers overestimate the benefits from health club subscriptions because they overestimate how often they will attend the health club.41 Consumers overestimate the benefits, or underestimate the risks, from different types of foods because they do not understand the meaning of “organic,” “natural,” “fruit juice drink,” and other enticing labels.42 And consumers underestimate the price that they will pay for credit cards, cell phone plans, mortgages, and many other products and services.43
In most cases, the misperception manifests as an overestimation of value or underestimation of price. The reason is that sellers and service providers have strong incentives to promote overestimation of value and combat underestimation of value and, similarly, to promote underestimation of price and combat overestimation of price. Indeed, sellers and service providers design their products, contracts, and pricing schemes to create or enhance misperceptions that increase consumers’ WTP.44 Therefore, the analysis in the next Part focuses on the implications of algorithmic price discrimination when the perceived WTP exceeds the true WTP.45 (In some markets, misperception manifests as an underestimation of value, or overestimation of price, such that the perceived WTP is smaller than the actual WTP. This possibility is explored in the Appendix.)
Before turning to that analysis, however, it is important to emphasize the link between price discrimination and consumer misperception. We have seen that sellers increasingly use big data and sophisticated algorithms to identify a consumer’s WTP and set personalized prices—namely, to price discriminate. We have also seen that WTP is generally the product of both preferences and (mis)perceptions. It follows that price discrimination will target both preferences and misperceptions as equally important determinants of a consumer’s WTP.46
Indeed, sellers are striving to improve their understanding of consumer perceptions and misperceptions. Industry publications suggest that big data and sophisticated algorithms are being used to redefine the relationship with the consumer—to create “a different engagement effect with a particular consumer based on what frame of mind they’re in at that point in time.”47 The reference to a consumer’s “frame of mind” suggests that sellers and service providers are reaching beyond preferences and entering the realm of perceptions and misperceptions. Related accounts suggest that Facebook and Google are using the vast amounts of data at their disposal to implement “cognitive” services, including “assessing someone’s personality by sifting through their writings.”48 These services can then be utilized directly by Facebook and Google or offered to other sellers and service providers. Again, the reference to “cognitive” services that assess a consumer’s personality suggests that sellers are trying to identify the misperception component of the WTP.
As observed by Professor Ryan Calo, “Emerging methods of big data present a new and vastly more efficient way to identify cognitive bias by attempting to pinpoint profitable anomalies.”49 Calo further suggests that emerging technologies will “empower corporations to discover and exploit the limits of each individual consumer’s ability to pursue his or her own self-interest. Firms will increasingly be able to trigger irrationality or vulnerability in consumers.”50 While sellers are evidently interested in consumer psychology, the analysis below does not depend on sellers’ ability to disentangle the preference-based and misperception-based components of the WTP. Indeed, to price discriminate, sellers need to know only the full, albeit misguided, WTP.
II. Market Outcomes and Welfare Effects
My goal is to study the effects of both price discrimination and misperception and, specifically, the interaction between price discrimination and misperception. I therefore construct and study the following two-by-two matrix:
| Misperception | ||||
|---|---|---|---|---|
| No | Yes | |||
| Price Discrimination | No | No Misperception, No Price Discrimination (Figure 1B) |
Misperception, No Price Discrimination (Figure 2B) |
|
| Yes | No Misperception, With Price Discrimination (Figure 1C) |
Misperception, With Price Discrimination (Figure 2C) |
||
The “No Misperception” column replicates the conventional microeconomic analysis of first-degree price discrimination and how it compares to a no–price-discrimination benchmark.51 I review this analysis briefly in Part II.A. Then, in Part II.B, I turn to the “Yes Misperception” column, the main contribution of this Essay. (As I explain above, I focus initially on demand-inflating misperceptions. I discuss demand-deflating misperceptions in the Appendix.)
A. No Misperception
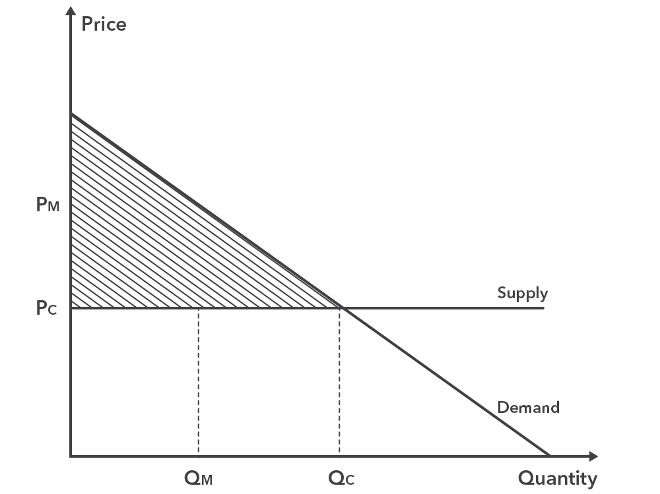
Consider the most basic market setup in Figure 1A, with a linear, downward sloping demand curve and a linear, horizontal supply curve (reflecting a fixed-per-unit-cost assumption; let k denote the per-unit cost).52 In a (perfectly) competitive market, the intersection of the demand curve with the supply curve, at (QC, PC), represents the market equilibrium, where QC represents the equilibrium quantity and PC represents the equilibrium price (which is equal to the per-unit cost, k).53 In terms of welfare, the shaded triangle represents the consumer surplus—the difference between the consumer’s WTP and the price, PC, aggregated across all consumers. (Some consumers have a high WTP. They are represented by the high points on the left side of the demand curve, and they enjoy more surplus. Other consumers have a lower WTP. They are represented by the lower points of the demand curve, close to QC, and they enjoy less surplus.) In a competitive market, the seller enjoys no surplus at all—selling her product at a price, PC, that precisely equals her per-unit cost of production. Therefore, social welfare is equal to the consumer surplus as represented by the shaded triangle.
Figure 1A: No Misperception, No Price Discrimination, Perfect Competition
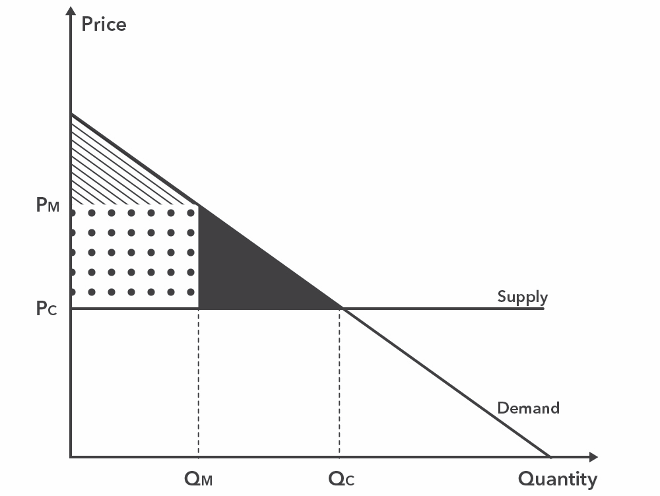
The perfect competition scenario serves as a useful baseline, but a monopolistic market is more relevant for our purposes because at least some degree of market power is necessary for price discrimination.54 (I focus on the extreme, monopoly case for ease of exposition.) To assess the effects of price discrimination, we must first consider, as a reference point, a monopolistic market in the absence of price discrimination—namely, when the monopolist sets a single price. As compared to the competition case, a monopolist will set a higher price, PM > PC, and sell fewer units of the product, QM < QC.55 Consumer surplus is now represented by the smaller shaded triangle. In a monopolistic market, the seller enjoys a positive surplus, represented by the dotted rectangle, which is equal to the number of units sold multiplied by the difference between the monopoly price and the per-unit cost: QM · (PM – k). Social welfare is, by definition, equal to the sum of the consumer surplus and the producer’s (monopolist’s) surplus. The black triangle represents the monopoly deadweight loss: because of the higher price that the monopolist charges, consumers who should buy the product refrain from purchasing it (specifically, the lost quantity is given by QC – QM); and the welfare that these lost purchases would have produced constitutes the monopoly deadweight loss.
Figure 1B: No Misperception, No Price Discrimination, Monopoly
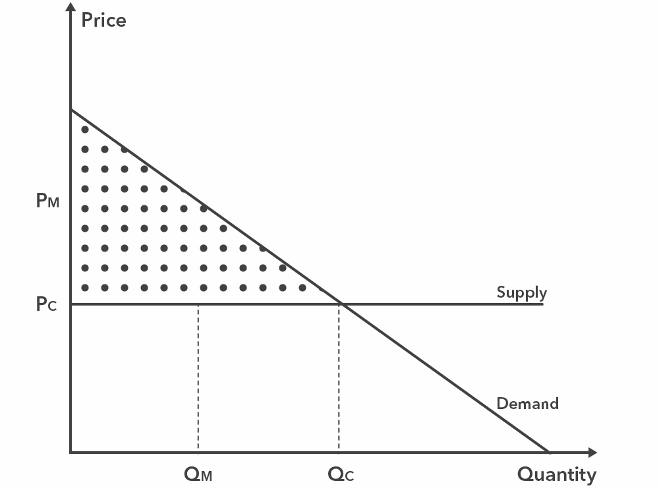
It is time to introduce price discrimination. Specifically, I now allow the monopolist to charge each consumer a different, personalized price. Using big data and sophisticated algorithms, the monopolist will identify each consumer’s WTP and set a personalized price just below this WTP. Thus, a consumer with a high WTP on the left side of the demand curve will pay a high price, and a consumer with a lower WTP toward the middle or right side of the demand curve will pay a lower price.56 Observe that the quantity sold is QC, as in the competition case. But while competition gives the entire surplus to consumers (the shaded triangle in Figure 1A), a price discriminating monopolist keeps the entire surplus for itself (the dotted triangle in Figure 1C; note that this dotted triangle is equal in size to the shaded triangle in Figure 1A). Price discrimination allows the monopolist to increase the quantity sold—from QM to QC—thus eliminating the deadweight loss and increasing the overall social welfare. This efficiency gain comes at a steep distributional price, however, as the entire surplus goes to the monopolist and consumers are left with nothing.57 Still, the efficiency gain is worth emphasizing. It is a powerful argument in favor of price discrimination in the standard, no misperception model. I next turn to the misperception case and show that this efficiency gain shrinks and might even become an efficiency loss.
Figure 1C: No Misperception, with Price Discrimination, Monopoly
B. Misperception
Consumers might either overestimate or underestimate the benefit from a product. I focus on overestimation for the reasons I note above—sellers have an incentive to promote overestimation and fight underestimation. I initially assume that the degree of overestimation is not correlated with consumers’ preference-based WTP—namely, that the average bias level is the same for consumers with a higher preference-based WTP at the left-hand side of the demand curve and for consumers with a lower preference-based WTP toward the middle and right-hand side of the demand curve. (This assumption is relaxed in Section A of the Appendix.) Now, in addition to the actual demand curve, we have a perceived demand curve. In Figures 2A, 2B, and 2C, the actual demand curve is represented by the solid downward sloping line, and the perceived demand curve is represented by the dashed downward sloping line.
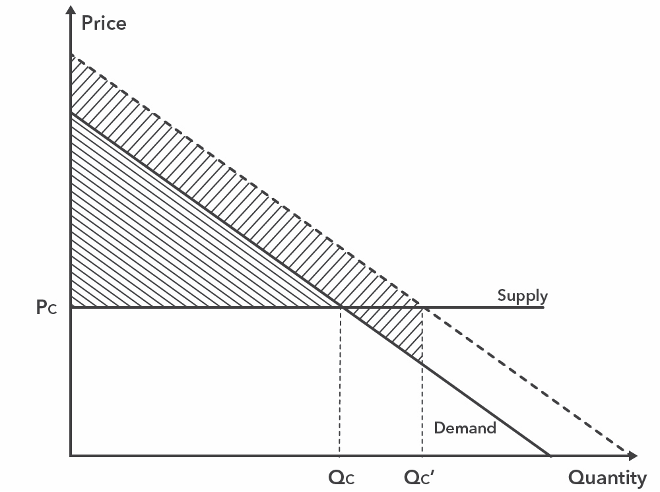
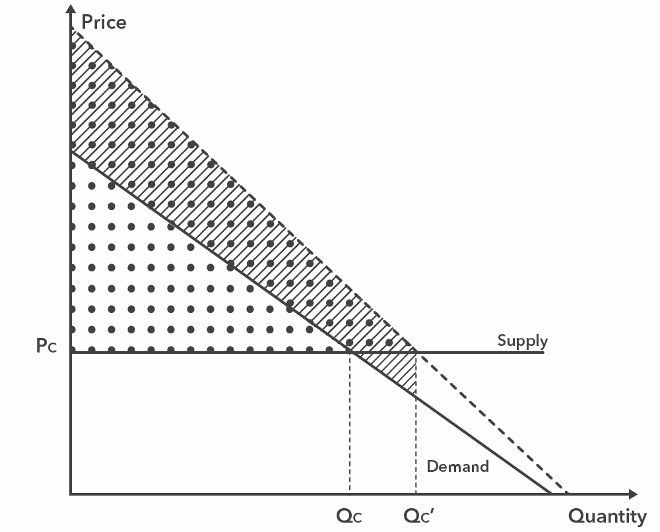
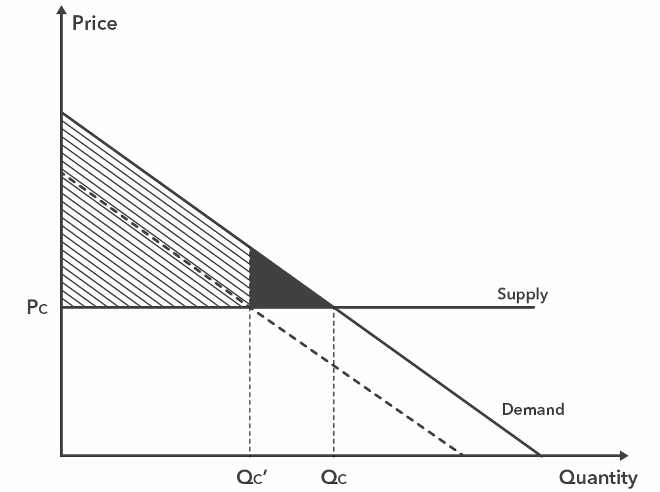
I start, as before, with the perfect competition baseline. In Figure 2A, the price remains PC = k, but the equilibrium quantity, QC', is larger. This quantity is determined by the intersection of the supply curve with the perceived demand curve. In welfare terms, consumers in the [0, QC] range still enjoy the same consumer surplus as in the no misperception case. This surplus is represented by the downward sloping–shaded triangle. These consumers mistakenly believe that they are getting an even larger surplus—the perceived extra surplus is represented by the upward sloping–shaded trapezoid (above the supply curve)—but this false belief does not harm them. There is, however, another group of consumers who are harmed. These consumers, in the [QC, QC'] range, should not purchase the product. They buy only because of the misperception—they overestimate the product’s value. These purchases create a welfare loss, which is both an efficiency loss and a loss to consumers (namely, the consumers bear the entire efficiency loss). This loss is represented by the upward sloping–shaded triangle (below the supply curve).
Figure 2A: Overestimation, No Price Discrimination, Perfect Competition
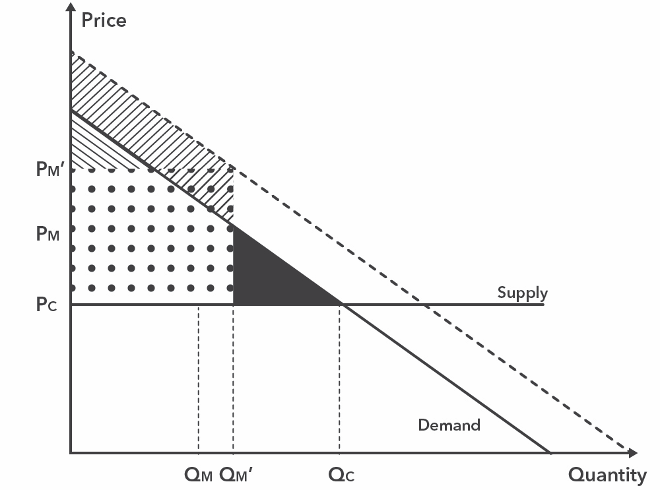
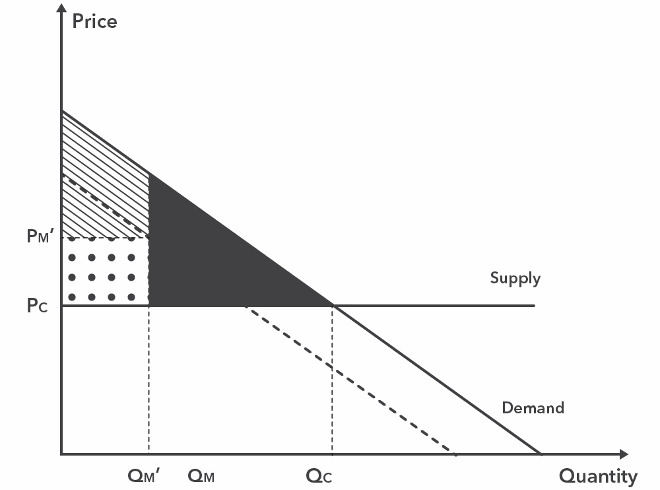
Next, consider a monopolistic market but without price discrimination. In the standard model, without misperception, the monopoly price is determined by the demand curve.58 And when consumers overestimate the value of the product, the price is determined by the perceived demand curve. Therefore, the monopoly price with misperception, PM', is higher than the monopoly price without misperception, PM. The quantity sold with misperception, QM', is also higher than the quantity sold without misperception, QM.59 Turning to welfare: The higher price reduces the actual consumer surplus, which is represented by the shaded triangle. The perceived surplus is larger—the perceived extra surplus is represented by the shaded trapezoid. Overestimation causes some consumers to purchase the product even though its actual value to them is lower than the price, PM'. The loss incurred by these consumers is represented by the dotted and shaded triangle. This loss reduces the (actual) consumer surplus. Indeed, the consumer surplus might be negative—the dotted and shaded triangle might be larger than the shaded triangle. But whatever consumers lose, the monopolist gains. The dotted and shaded triangle is part of the dotted rectangle, which represents the monopolist’s surplus. Therefore, we have a distributional effect but no reduction in efficiency. Indeed, misperception increases efficiency. By inflating demand, the overestimation bias increases the quantity sold—from QM to QM'—and thus reduces the monopoly deadweight loss, which is represented by the black triangle. Notice that the black triangle in Figure 2B is smaller than the black triangle in Figure 1B.
Figure 2B: Overestimation, No Price Discrimination, Monopoly
When the misperception is even stronger and the perceived demand curve shifts even higher above the actual demand curve, the quantity, QM', can be larger than QC. In this case, the black triangle disappears entirely, and the problem of insufficient purchases is replaced with a problem of excessive purchases. Specifically, consumers in the [QC, QM'] range inefficiently purchase the product. Misperception can either increase or decrease overall efficiency in this market, depending on the relative magnitudes of the insufficient purchases problem (without misperception) and the excessive purchases problem (with misperception).
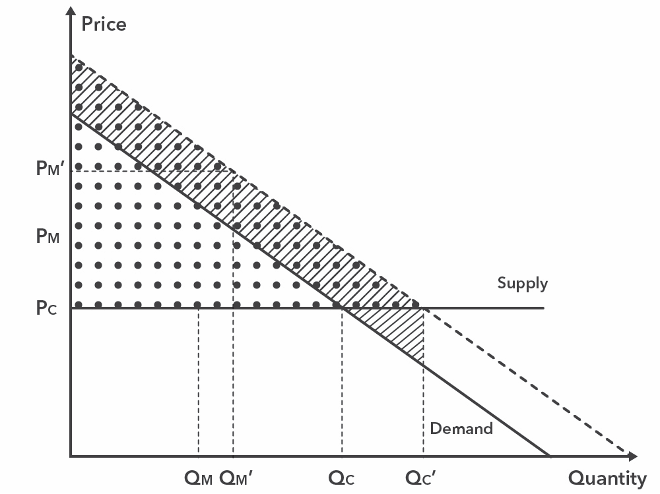
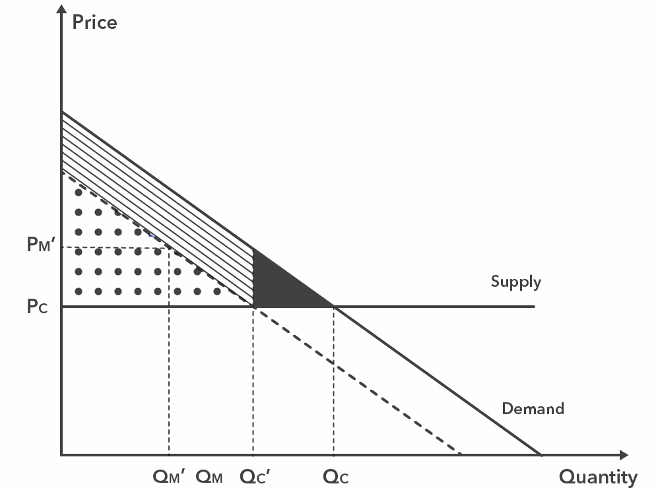
Finally, consider a monopolistic market with price discrimination. The monopolist charges an individual price for each consumer based on each consumer’s WTP.60 Whereas WTP is derived only from preferences in the standard model (see Figure 1C), now WTP is a product of both preferences and misperceptions (see Figure 2C). Price discrimination allows the monopolist to march down the demand curve, setting different prices for different consumers. In the standard model, the monopolist marched down the actual demand curve. Now the monopolist is marching down the perceived demand curve. Turning to welfare: In the standard model, the monopolist extracted the entire surplus. Consumers gained nothing but also lost nothing. Here the monopolist is also extracting perceived surplus, which is represented by the dotted and shaded trapezoid. This extra gain to the monopolist is a loss to consumers; the dotted and shaded trapezoid represents a transfer from consumers to the monopolist—a distributional effect with no efficiency implications.61 But price discrimination in a model with misperceptions also has efficiency implications. Consumers in the [QC, QC'] range should not purchase the product. They buy only because they overestimate the product’s value. These purchases create an efficiency loss, which is also a loss to consumers (namely, the consumers bear the entire efficiency loss). This loss is represented by the upward sloping–shaded triangle (below the supply curve).62
Figure 2C: Overestimation, with Price Discrimination, Monopoly
In the standard model,63 in which WTP is derived from preferences alone, price discrimination hurts consumers but increases efficiency. Specifically, consumers enjoy no surplus at all, but there is no deadweight loss. With overestimation, price discrimination hurts consumers even more and may either increase or decrease efficiency. Consumers are hurt more because now they give up surplus that they do not have—perceived surplus—and thus end up with a loss. In terms of efficiency, the insufficient quantity problem is avoided, but an excessive quantity problem is created. Whether price discrimination increases or decreases efficiency depends on the relative magnitudes of the black triangle in Figure 2B and the upward sloping–shaded triangle in Figure 2C. And when the misperception is stronger such that QM' is larger than QC, price discrimination definitely decreases efficiency. In this case, there is an excessive quantity problem even in the absence of price discrimination, and price discrimination only exacerbates this problem.64
III. Policy Implications
In the standard model, price discrimination is bad for consumers but good for efficiency. The need for legal intervention thus depends on the relative weight of efficiency and distribution in the social objective function.65 (Unless the adverse distributional implications can be neutralized through an appropriate adjustment to the tax and transfer system.66 ) Adding demand-inflating misperception, price discrimination is even worse for consumers and might not have any redeeming efficiency advantage. Therefore, when price discrimination targets misperception-based WTP in addition to preference-based WTP, the case for legal intervention becomes stronger. In particular, we should consider policies that curb price discrimination, even if we were uncertain about such policies in a world without misperception.
There are different ways to curb algorithmic price discrimination. Policymakers could impose a direct prohibition against price discrimination. But this seems too blunt. They could facilitate market forces that interfere with price discrimination, specifically by making arbitrage easier and by disseminating information that could trigger a fairness-based consumer backlash.67 (Regulators could also force sellers to disclose the lowest price for which the product or service was recently sold.) Or policymakers could target the foundation of algorithmic price discrimination: big data. Algorithmic price discrimination is fueled by big data, so this extreme form of price discrimination can be curbed by limiting sellers’ access to information about consumers’ WTP—namely, by increasing privacy protections and data security measures.68 But big data and personalization generate benefits as well as costs, and it is not clear whether choking off the flow of information would provide a net gain for consumers.
What about personalized law? Algorithmic price discrimination occurs when sellers gain information about each consumer’s individual WTP and set a personalized price equal to that consumer’s WTP. When sellers utilize personalized pricing, policymakers can respond with personalized price caps. Price caps are a common policy response to excessive pricing.69 The conventional price cap applies uniformly to the entire market. But such a uniform price cap is a very blunt instrument. Why must a rich consumer pay the same capped price as a poor consumer? Why must a consumer who gains substantial value from a product pay the same price as a consumer who gains much less value from the product? Personalized price caps provide a subtler response.
The idea of personalized price caps was recently proposed by Ziv Ben-Shahar as a response to fairness concerns about price discrimination in a world without misperception.70 But a personalized price cap can also directly address the extra harm that price discrimination inflicts on consumers who overestimate the benefit of a product. Specifically, a price cap equal to the individual consumer’s preference-based WTP would neutralize the effects of the misperception. Of course, regulators would need a lot of information to implement such a personalized price-cap regime. In particular, they would need to distinguish between the preference-based and misperception-based components of each consumer’s WTP. But in the world of big data, perhaps this obstacle is not insurmountable.71
A softer personalized-law approach replaces price caps with disclosure mandates. While disclosure mandates are a conventional regulatory solution,72 this traditional technique has an interesting, nontraditional twist in the present context. In a world of personalized pricing—the world of price discrimination—disclosure mandates should also be personalized. Namely, sellers should be made to provide each consumer with individualized information on the product’s true value to that particular consumer. With such a disclosure, consumers will be able to separate out the misperception-based component of their WTP and thus avoid overpaying.73 (It is not clear, however, if sellers would have, or could easily acquire, the information that they are required to disclose. As suggested above, sellers have a strong incentive to identify consumers’ overall WTP, but they do not have a strong incentive to disentangle the misperception-based component of the WTP from the preference-based component.)
Conclusion
This Essay considered the positive and normative implications of sellers’ increasing ability to price discriminate—to set personalized prices—when consumers’ WTP is the product of both preferences and (mis)perceptions. The shift from a standard neoclassical model, in which WTP reflects only preferences, to a more realistic behavioral model, in which misperceptions significantly influence consumers’ WTP, forces a substantial revision of standard results. Price discrimination, which appeared less harmful, if not beneficial, in the neoclassical model, is revealed in the behavioral model as a much more damaging, welfare-reducing practice, at least when the misperception results in inflated demand (which, as argued above, is likely the most common case).
Personalized pricing thus requires a policy response. And while existing legal frameworks can be used to combat price discrimination, the most promising or, at least, the most intriguing policy response would fight personalized prices with personalized law. Personalized price caps and personalized disclosure can effectively reduce the adverse effects of price discrimination by curbing sellers’ ability to set prices above consumers’ true, preference-based WTP. When the market employs personalization, regulators should fight fire with fire and seriously explore the potential of personalized law.
Appendix
The Appendix considers two extensions. Section A discusses the effects of a positive or negative correlation between the two components of WTP—preferences and misperceptions. Section B studies demand-deflating misperceptions.
A. Misperceptions Correlated with Preference-Based WTP
The analysis in the text assumes that the degree of misperception is not correlated with the consumer’s preference-based WTP. Graphically, this assumption is represented by a perceived demand curve that is parallel to the actual demand curve. Put differently, the perceived demand curve is represented by an upward shift from the actual demand curve. What happens when the degree of misperception is correlated with the preference-based WTP?
From an efficiency perspective, the problem with misperception is that marginal consumers with a low preference-based WTP buy a product that they shouldn’t buy. Therefore, the efficiency loss depends on the bias level of these marginal consumers. And the bias level of the marginal consumers depends, in turn, on the following two factors: (1) whether the correlation between consumers’ bias level and their preference-based WTP is positive or negative; and (2) the per-unit cost of production or, more generally, the location of the supply curve in relation to the demand curve.
The nature of the correlation between the misperception-based and preference-based components of the WTP merits elaboration. When will this correlation be positive, and when will it be negative? While a complete typology is beyond the scope of this Essay, it is useful to consider the following general scenarios: First, the correlation between consumers’ bias levels and their preference-based WTP will be positive when bias is proportional to (actual) value. For example, assume that Consumer A will attend the gym twice a week and thus derive a value of $1,000 from gym membership and that Consumer B will attend the gym four times a week and thus derive a value of $2,000 from gym membership. (Consumer A’s preference-based WTP is $1,000, and Consumer B’s preference-based WTP is $2,000.) Now assume that both consumers overestimate the frequency of their gym visits by 50 percent. Consumer A thinks that she will attend three times a week and thus derive a value of $1,500, and Consumer B thinks that he will attend six times a week and thus derive a value of $3,000. The same 50 percent bias level increases consumer A’s WTP by $500 ($1,500 − $1,000) and Consumer B’s WTP by $1,000 ($3,000 − $2,000). Second, the correlation between consumers’ bias levels and their preference-based WTP will be negative when bias is negatively correlated with wealth. It is not that poor people are more prone to bias; rather, rich people can afford to hire expert advisers—human or virtual—that mitigate bias and misperception. And so, if preference-based WTP is positively correlated with wealth, and wealth is negatively correlated with bias levels, then the preference-based WTP will be negatively correlated with bias levels.74
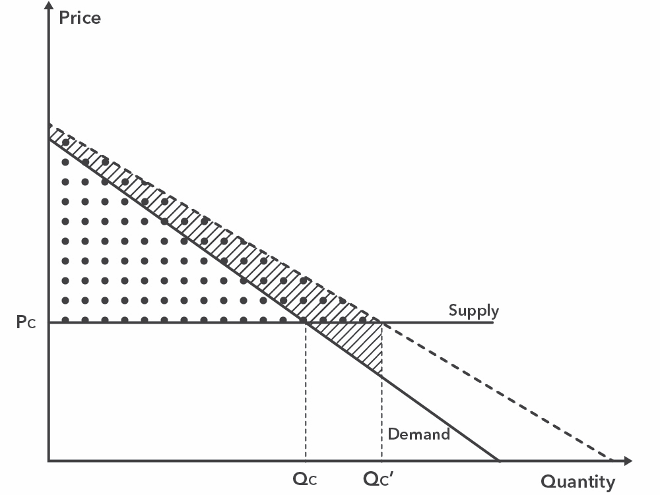
I start with the positive correlation case. In this case, the distance between the perceived and actual demand curves is larger at the left-hand side of the graph and smaller at the right-hand side of the graph. See Figure 3A. Therefore, when the per-unit production cost is low (that is, the supply curve is low in relation to the demand curve), the efficiency cost of price discrimination is smaller relative to the uncorrelated misperceptions case.75 This low per-unit-cost case is depicted in Figure 3A. The upward sloping–shaded triangle (below the supply curve) is smaller in Figure 3A, as compared to Figure 2C. In contrast, when the per-unit production cost is high (that is, the supply curve is high in relation to the demand curve), the efficiency cost of price discrimination is larger relative to the uncorrelated misperceptions case. Turning to the distributional implications of price discrimination, the perceived surplus that the monopolist extracts, represented by the dotted and shaded quadrilateral, is larger relative to the uncorrelated misperceptions case; and this result holds regardless of the magnitude of the per-unit production cost. Intuitively, the positive per-unit cost truncates the perceived demand curve and the overestimation bias; this truncation effect is smaller in the positive correlation case.
Figure 3A: Correlated Misperceptions—Positive Correlation
Next, consider the negative correlation case. In this case, the distance between the perceived and actual demand curves is smaller at the left-hand side of the graph and larger at the right-hand side of the graph. See Figure 3B. Therefore, when the per-unit production cost is low (that is, the supply curve is low in relation to the demand curve), the efficiency cost of price discrimination is larger relative to the uncorrelated misperceptions case. This low per-unit-cost case is depicted in Figure 3B. The upward sloping–shaded triangle (below the supply curve) is larger in Figure 3B, as compared to Figure 2C. In contrast, when the per-unit production cost is high (that is, the supply curve is high in relation to the demand curve), the efficiency cost of price discrimination is smaller relative to the uncorrelated misperceptions case. Turning to the distributional implications of price discrimination, the perceived surplus that the monopolist extracts, represented by the dotted and shaded quadrilateral, is smaller relative to the uncorrelated misperceptions case; and this result holds regardless of the magnitude of the per-unit production cost. Intuitively, the positive per-unit cost truncates the perceived demand curve and the overestimation bias; this truncation effect is larger in the negative correlation case.
Figure 3B: Correlated Misperceptions—Negative Correlation
In the standard model, without misperception, price discrimination hurts consumers but increases efficiency. With demand-inflating misperception, price discrimination hurts consumers even more and either increases or decreases efficiency. Correlated misperceptions add nuance to these results. The extra harm that consumers incur is larger in the positive correlation case and smaller in the negative correlation case. In terms of efficiency, price discrimination is more likely to reduce efficiency (1) in the positive correlation case when the per-unit production cost is high, and (2) in the negative correlation case when the per-unit product cost is low. These results are summarized in Table 2.
| Per-Unit Production Cost | |||
|---|---|---|---|
| Correlation between Bias Level and Preference-Based WTP |
Low | High | |
| Positive | Smaller Efficiency Cost Larger Distributional Effect |
Larger Efficiency Cost Larger Distributional Effect |
|
| Negative | Larger Efficiency Cost Smaller Distributional Effect |
Smaller Efficiency Cost Smaller Distributional Effect |
|
Allowing for a positive or negative correlation between preferences and misperceptions adds nuance to the analysis—either increasing or decreasing the efficiency costs and distributional effects of price discrimination. But the bottom line remains: the behavioral model, in which WTP is derived from both preferences and misperceptions, reveals price discrimination to be more harmful than previously believed.
B. Demand-Deflating Misperceptions
The analysis in the text focuses on demand-inflating misperceptions—namely, on overestimation of benefit or underestimation of price. I argue that these misperceptions are likely the more prevalent type. Still, in some markets, a demand-deflating misperception, either underestimation of value or overestimation of price, can reduce the perceived WTP below the actual WTP. To complete the analysis, I study such demand-deflating misperceptions and how they interact with algorithmic price discrimination.76
I start, as before, with the perfect competition baseline. The price remains PC = k, but the equilibrium quantity, QC', is smaller. This quantity is determined by the intersection of the supply curve with the perceived demand curve. See Figure 4A. In welfare terms, consumers in the [0, QC'] range still enjoy the same consumer surplus as in the no misperception case. This surplus is represented by the downward sloping–shaded trapezoid. These consumers mistakenly believe that they are getting a smaller surplus—represented by the downward sloping–shaded triangle—but this false belief does not harm them. There is, however, another group of consumers who are harmed. These consumers, in the [QC', QC] range, should purchase the product, but don’t, because of the misperception. These missed purchases create a welfare loss—an efficiency loss that is borne entirely by consumers. This loss is represented by the black triangle.
Figure 4A: Underestimation, No Price Discrimination, Perfect Competition
Next, consider a monopolistic market but without price discrimination. In the standard model, without misperception, the monopoly price is determined by the demand curve. And when consumers underestimate the value of the product, the price is determined by the perceived demand curve. Therefore, the monopoly price with misperception, PM', is lower than the monopoly price without misperception, PM. The quantity sold with
misperception, QM', is also smaller than the quantity sold without misperception, QM.77
Turning to welfare: In the standard model, without misperception, monopoly pricing prevents some efficient purchases, thus creating the infamous monopoly deadweight loss. The underestimation bias prevents additional, efficient purchases from taking place, thus increasing the deadweight loss. Graphically, we see that the black triangle in Figure 4B is larger than the black triangle in Figure 1B. Note that consumers in the [0, QM'] range who purchase the product despite the misperception enjoy a larger surplus thanks to the lower price.
Figure 4B: Underestimation, No Price Discrimination, Monopoly
Finally, consider a monopolistic market with price discrimination. The monopolist charges an individual price for each consumer based on each consumer’s WTP. See Figure 4C. Turning to welfare, price discrimination clearly increases efficiency—it reduces the deadweight loss because more consumers purchase the product. Graphically, the black triangle in Figure 4C is smaller than the black triangle in Figure 4B.78 The effect on the consumer surplus, however, is ambiguous. In the standard model, the monopolist extracted the entire surplus. Consumers gained nothing. Here, the monopolist can extract only the underestimated perceived surplus, which is represented by the dotted triangle. The consumers are left with the difference between the actual surplus and the perceived surplus, which is represented by the shaded parallelogram. So consumers enjoy a positive surplus, but it is not clear whether this surplus is larger or smaller than the surplus that they enjoy in the absence of price discrimination. On the one hand, more consumers buy the product and enjoy this difference between the actual and perceived surplus. On the other hand, the consumers who also would have purchased the product in the absence of price discrimination enjoy a smaller surplus (because they are charged a higher, personalized price).
Figure 4C: Underestimation, With Price Discrimination, Monopoly
In the standard model,79 in which WTP is derived from preferences alone, price discrimination hurts consumers but increases efficiency. Specifically, consumers enjoy no surplus at all, but there is no deadweight loss. With overestimation, price discrimination hurts consumers even more and may either increase or decrease efficiency. Here, with underestimation, price discrimination clearly increases efficiency and may or may not hurt consumers. These results can be further refined by considering (as I did in Section A of this Appendix) possible correlations—a positive correlation or a negative correlation—between the degree of misperception and consumers’ preference-based WTP. But the basic conclusion remains: algorithmic price discrimination is less worrisome in markets with underestimation. And as a result, legal intervention is less necessary in markets with demand-deflating misperceptions.
- 1See Alessandro Acquisti, Curtis Taylor, and Liad Wagman, The Economics of Privacy, 54 J Econ Lit 442, 466 (2016) (“Tracking and measurability, in addition to websites’ ability to dynamically update and personalize prices for each visitor, are bringing online markets closer to the theoretical scenario of first-degree price discrimination.”). This Essay focuses on price discrimination that is based on a consumer’s willingness to pay (WTP). It does not engage with race-based or gender-based discrimination, including price discrimination, that is unrelated to the consumer’s WTP. Note that, in some cases, WTP is correlated with race and gender, and the resulting price discrimination can be analyzed using the model that this Essay develops.
- 2See note 24–26.
- 3See note 29.
- 4See note 30.
- 5See note 31.
- 6See note 23.
- 7See notes 32–34.
- 8See, for example, Andreu Mas-Colell, Michael D. Whinston, and Jerry R. Green, Microeconomic Theory 6–9, 40–63 (Oxford 1995) (explaining that consumers’ individual preferences, described as utility functions, determine their optimal consumption levels); Hal R. Varian, Intermediate Microeconomics 54–55 (Norton 8th ed 2010) (same).
- 9This Essay adopts a broad definition of “misperception,” including any mistake that affects the consumer’s WTP.
- 10See Mas-Colell, Whinston, and Green, Microeconomic Theory at 386–87 (cited in note 8) (“Of course, the distributional properties of this outcome would not be terribly attractive in the absence of wealth redistribution: The monopolist would get all the aggregate surplus generated by its product, and each consumer i would receive a surplus of zero.”); Varian, Intermediate Microeconomics at 463–65, 480–81 (cited in note 8) (describing how perfect price discrimination enables a monopolist to “appropriate [consumer] surplus for itself”); Acquisti, Taylor, and Wagman, 54 J Econ Lit at 447, 452, 454–57, 466–67 (cited in note 1); Curtis R. Taylor, Consumer Privacy and the Market for Customer Information, 35 RAND J Econ 631, 643 (2004) (finding that personalized pricing can have disparate effects on consumer surplus and total welfare). See also Big Data: Seizing Opportunities, Preserving Values: Interim Progress Report *7–8 (Executive Office of the President, Feb 2015), archived at http://perma.cc/P658-P5G9 (referencing a White House Council of Economic Advisors study, which found that differential pricing “will often, though not always, be welfare-enhancing” but “can raise concerns about fairness”); Natasha Singer, The Government’s Consumer Data Watchdog (NY Times, May 23, 2015), online at http://www.nytimes.com/2015/05/24/technology/the-governments-consumer-data-watchdog.html (visited Oct 31, 2018) (Perma archive unavailable) (quoting Hal R. Varian, Chief Economist of Google and professor emeritus at the School of Information at the University of California, Berkeley, about price discrimination: “It is largely beneficial,” Mr. Varian told the audience, citing examples such as discount offers for seniors. He added, “You charge higher prices to people who can afford to pay higher prices.”).
- 11See Louis Kaplow and Steven Shavell, Why the Legal System Is Less Efficient than the Income Tax in Redistributing Income, 23 J Legal Stud 667, 669, 674 (1994).
- 12See Paul Heidhues and Botond Kőszegi, Naïveté-Based Discrimination, 132 Q J Econ 1019, 1020–21, 1026–27 (2017) (arguing that price discrimination that targets consumers’ naïveté, a type of misperception, reduces welfare, albeit for reasons that are different than those analyzed here); Ariel Ezrachi and Maurice E. Stucke, Virtual Competition: The Promise and Perils of the Algorithm-Driven Economy 31–32, 117–30 (Harvard 2016) (arguing that “behavioral discrimination”—the authors’ term for discrimination that targets cognitive biases—represents a starker wealth transfer from consumers to producers than traditional “price discrimination,” specifically, “[t]his behavioral discrimination can increase consumption, optimize the extraction of wealth, and affect other important values, such as privacy, equality and fairness”).
- 13The analysis compares no price discrimination to perfect price discrimination. I omit the qualifier “perfect” for the sake of brevity. Most of the results hold also with imperfect price discrimination.
- 14Another example of undesirable matching occurs when sellers vary the quality of an offered product or service based not on the consumer’s preferences but on other factors that make the consumer less profitable to the seller or reduce the consumer’s threat to switch to a competitor. For example, CableOne bragged that it offered worse customer service to customers with low FICO scores. See Karl Bode, CableOne Brags It Provides Worse Service to Bad Credit Customers (DSL Reports, May 27, 2016), archived at http://perma.cc/F8PX-NKKH. See David Gilo and Ariel Porat, The Hidden Roles of Boilerplate and Standard-Form Contracts: Strategic Imposition of Transaction Costs, Segmentation of Consumers, and Anticompetitive Effects, 104 Mich L Rev 983, 986, 988–1002 (2006) (discussing other costs of quality-based discrimination, focusing on contractual terms as a quality dimension).
- 15See, for example, What Does Phone Usage Say about Creditworthiness? (PYMNTS.com, Dec 1, 2015), archived at http://perma.cc/KZ6Y-ZJ7B (discussing how several Silicon Valley start-ups have used the large amount of data collected on consumers’ phones to assess their creditworthiness and offer them small loans at lower interest rates). See also Ezrachi and Stucke, Virtual Competition at 90 (cited in note 12) (citing a 2010 Wall Street Journal report that showed Capital One personalized its credit card offers based on new users’ credit scores).
- 16See, for example, Oren Bar-Gill, Price Caps in Multiprice Markets, 44 J Legal Stud 453, 464–69 (2015).
- 17The idea to use personalized price caps was first suggested by Ziv Ben-Shahar. Ziv Ben-Shahar, The Ethics and Regulation of Personalized Pricing *28–35 (unpublished thesis, Macalester College, 2017), archived at http://perma.cc/HDF7-DXAR.
- 18See Oren Bar-Gill, Seduction by Contract: Law, Economics and Psychology in Consumer Markets 33–36 (Oxford 2012); Christoph Busch, Implementing Personalized Law: Personalized Disclosures in Consumer Law and Data Privacy Law, 86 U Chi L Rev 309, 313–14 (2019).
- 19Employers have long screened applications based on credit reports and background checks, but many now also research a candidate’s presence online. See Jennifer Preston, Social Media History Becomes a New Job Hurdle (NY Times, July 21, 2011), online at http://www.nytimes.com/2011/07/21/technology/social-media-history-becomes-a-new-job-hurdle.html (visited Nov 1, 2018) (Perma archive unavailable); Online Reputation in a Connected World *6 (Cross-Tab, Jan 2010), archived at http://perma.cc/2JZY-CN6R (reporting that 75 percent of US employers research applicants online). See generally Ian Byrnside, Note, Six Clicks of Separation: The Legal Ramifications of Employers Using Social Networking Sites to Research Applicants, 10 Vand J Enter & Tech L 445 (2008); Nathan J. Ebnet, Note, It Can Do More than Protect Your Credit Score: Regulating Social Media Pre-employment Screening with the Fair Credit Reporting Act, 97 Minn L Rev 306 (2012).
- 20See, for example, Liz Mineo, On Internet Privacy, Be Very Afraid (Harvard Gazette, Aug 24, 2017), archived at http://perma.cc/XK4U-4KLW (quoting cybersecurity expert Bruce Schneier: “I used to say that Google knows more about me than my wife does, but that doesn’t go far enough.”); Sandy Parakilas, We Can’t Trust Facebook to Regulate Itself (NY Times, Nov 19, 2017), available at http://www.nytimes.com/2017/11/19/
opinion/facebook-regulation-incentive.html (visited Nov 2, 2018) (Perma archive unavailable) (describing Facebook as “a company that reaches most of the country every day and has the most detailed set of personal data ever assembled” in an op-ed by a former operations manager); Data Brokers: A Call for Transparency and Accountability *23–31 (Federal Trade Commission, May 2014), archived at http://perma.cc/45BT-NY5F (describing how data brokers sell retailers a variety of marketing products and how five of the top brokers alone generated revenue of nearly $200 million in 2012); Akiva A. Miller, What Do We Worry about When We Worry about Price Discrimination? The Law and Ethics of Using Personal Information for Pricing, 19 J Tech L & Pol 41, 45–47 (2014) (listing a number of techniques that online and brick-and-mortar retailers use to capture customer data). - 21See Big Data: Seizing Opportunities, Preserving Values at *7–8 (cited in note 10) (noting that companies increasingly use big data for personalized pricing); Miller, 19 J Tech L & Pol at 45–47 (cited in note 20) (describing how online sellers are increasingly able to identify users and collect personal data, target their advertising and coupons, and adjust prices rapidly and automatically); Adam Tanner, Different Customers, Different Prices, Thanks to Big Data (Forbes, Mar 26, 2014), archived at http://perma.cc/UW5W-WQS6; Frederik Zuiderveen Borgesius and Joost Poort, Online Price Discrimination and EU Data Privacy Law, 40 J Consumer Pol 347, 348–50 (2017).
- 22See Miller, 19 J Tech L & Pol at 49–54 (cited in note 20); Aniko Hannak, et al, Measuring Price Discrimination and Steering on E-commerce Web Sites, Proceedings of the 2014 Conference on Internet Measurement Conference 305, 316 (Nov 2014).
- 23Hannak, et al, Measuring Price Discrimination at 317 (cited in note 22).
- 24See Scott Duke Kominers, Uber’s New Pricing Idea Is Good Theory, Risky Business (Bloomberg, June 13, 2017), archived at http://perma.cc/2T8E-J5K8.
- 25See Jakub Mikians, et al, Detecting Price and Search Discrimination on the Internet *4–5 (Proceedings of the 11th Association for Computing Machinery Workshop on Hot Topics in Networks, Oct 2012), archived at http://perma.cc/GP59-2QZQ.
- 26See Eric Newcomer, Uber Starts Charging What It Thinks You’re Willing to Pay (Bloomberg, May 19, 2017), archived at http://perma.cc/J5XT-L32K:
Uber calculates riders’ propensity for paying a higher price for a particular route at a certain time of day. For instance, someone traveling from a wealthy neighborhood to another tony spot might be asked to pay more than another person heading to a poorer part of town, even if demand, traffic and distance are the same.
- 27See Hannak, et al, Measuring Price Discrimination at 315–16 (cited in note 22). But see Mikians, et al, Detecting Price and Search Discrimination at *2 (cited in note 25) (noting that their study found that “different OS/Browser combinations do not seem to impact prices”).
- 28See Kyle James, Abandon Shopping Cart: 17 Online Retailers Who’ll Bait You Back with a Coupon (Rather-Be-Shopping.com, July 18, 2014), archived at http://perma.cc/2GJU-GU74 (identifying eighteen retailers that offered coupons to customers who abandoned their carts, including Toys “R” Us, Bass Pro Shops, Bed Bath & Beyond, Dick’s Sporting Goods, JC Penney, Macy’s, OfficeMax, and Williams-Sonoma).
- 29See Sal Thomas, Does Dynamic Pricing Risk Turning Personalisation into Discrimination? (Campaign, Oct 22, 2014), archived at http://perma.cc/8TNU-FCJN.
- 30See In-Store Tracking Tech Gets Personalized (PYMNTS.com, Feb 9, 2018), archived at http://perma.cc/MA5V-PTJV (noting the trend toward digitized and personalized pricing in the grocery market, using coupons).
- 31See Ezrachi and Stucke, Virtual Competition at 90–91 (cited in note 12).
- 32See Tanner, Different Customers, Different Prices (cited in note 21).
- 33See id.
- 34The music industry example, TellApart, is discussed in Adi Libson and Gideon Parchomovsky, Toward the Personalization of Copyright Law, 86 U Chi L Rev 527, 531 (2019). For a discussion of a business TellApart took over—Freshplum—and other competitors, see Tanner, Different Customers, Different Prices (cited in note 21).
- 35This assumes that sellers have information only on the consumer’s use-based WTP—namely, the WTP that applies if the consumer purchases the product for personal use. For a consumer who plans to resell the product, the true WTP is higher than the use-based WTP. If sellers have information on the true WTP, then the arbitrage limit disappears.
- 36See Lars A. Stole, Price Discrimination and Competition, in Mark Armstrong and Robert H. Porter, eds, 3 Handbook of Industrial Organization 2223, 2226 (Elsevier 2007) (“It is well known that price discrimination is only feasible under certain conditions: (i) firms have short-run market power, (ii) consumers can be segmented either directly or indirectly, and (iii) arbitrage across differently priced goods is infeasible.”).
- 37See Daniel Kahneman, Jack L. Knetsch, and Richard Thaler, Fairness as a Constraint on Profit Seeking: Entitlements in the Market, 76 Am Econ Rev 728, 735–36 (1986); Zuiderveen Borgesius and Poort, 40 J Consumer Pol at 355–56 (cited in note 21). See also Eric T. Anderson and Duncan I. Simester, Price Stickiness and Customer Antagonism, 125 Q J Econ 729 (2010); Kominers, Uber’s New Pricing Idea (cited in note 24) (noting that successful price discrimination can result in bad publicity and shift business to competitors); Tanner, Different Customers, Different Prices (cited in note 21) (customers have reacted negatively to stories about differential pricing, leading companies to guard such policies or avoid surcharges in favor of personalized discounts, which consumers accept more). The importance of the fairness limit is debatable. For example, airlines have long charged substantially different prices for identical seats without triggering a significant consumer uproar. Either consumers are less sensitive to fairness concerns in this context, or the airlines have managed to keep the differential pricing less salient to most consumers.
- 38Consumers’ “aversion to surveillance” could impose another market-based limit on personalized pricing if the personalized pricing suggests to consumers that they are being surveilled by the seller. See Akiva, 19 J Tech L & Pol at 102–03 (cited in note 20).
- 39Budget constraints and wealth effects are relevant to the analysis in this Essay in two related ways: First, budget constraints and wealth effects suggest a positive correlation between WTP and wealth and are, therefore, relevant for identifying the distributional implications of price discrimination. Second, budget constraints and wealth effects suggest that a consumer’s WTP may be lower than the preference-based benefit that the consumer would gain from the product or service. This means that, in the standard model, perfect price discrimination does not leave consumers with zero surplus. And in the behavioral model, it means that perfect price discrimination may reduce the consumer’s gain from the transaction rather than inflict an actual loss. At the extreme, if budget constraints rather than preferences determine consumers’ WTP, then misperceptions about the benefit from a product or service will have no effect, although misperceptions about price (or about the budget constraint itself) would continue to affect the analysis.
- 40See Oren Bar-Gill and Kevin E. Davis, (Mis)perceptions of Law in Consumer Markets, 19 Am L & Econ Rev 245, 246–48 (2017) (citing evidence of consumer misperceptions about the benefits and risks associated with different food products and how such misperceptions affect purchasing decisions).
- 41See generally Stefano DellaVigna and Ulrike Malmendier, Paying Not to Go to the Gym, 96 Am Econ Rev 694 (2006).
- 42See Bar-Gill and Davis, 19 Am L & Econ Rev at 248 (cited in note 40); 21 CFR § 102.33(a) (regulating labels of beverages with fruit content).
- 43See Bar-Gill, Seduction by Contract at 52–54, 117, 185–86 (cited in note 18).
- 44Id at 24–25. On the other hand, there are market forces that work to reduce misperception. For example, if misperception benefits one seller, her competitor may try to educate consumers and reduce the misperception. See id at 30.
- 45There are important limits on the prevalence of demand-inflating misperceptions. First, if a seller promotes a misperception that boosts demand for her own product, this misperception may well reduce demand for her competitor’s product. Second, because consumers operate within a budget constraint, if all sellers attempt to inflate demand for their respective products, then these attempts will inevitably cancel out on average.
- 46See Heidhues and Kőszegi, 132 Q J Econ at 1020–21 (cited in note 12). Professors Paul Heidhues and Botond Kőszegi developed a model in which sellers price discriminate based on whether a consumer is sophisticated or naïve (or, more specifically, on the consumer’s degree of naïveté). Naïveté can be understood as a type of misperception—a misperception of one’s time preferences. One of the leading examples discussed by Heidhues and Kőszegi concerns misperceptions about the likelihood of using, perhaps inadvertently, the overdraft feature of a bank account and thus incurring overdraft fees. The authors explain how banks will offer different prices to different consumers, raising the overdraft fee charged to naïve consumers. See also Alexei Alexandrov, Generalizing Lessons from Behavioral Economics across Many Biases *8–14 (Consumer Financial Protection Bureau Research Paper, Aug 21, 2015), archived at http://perma.cc/MLJ6-CBFC (studying a general model of perfect price discrimination with a single biased consumer).
- 47Actionable Insights: Issuers’ 2015 Resolution (PYMNTS.com, Dec 30, 2014), archived at http://perma.cc/443W-FJ7Y.
- 48Fuel of the Future: Data Is Giving Rise to a New Economy (The Economist, May 6, 2017), archived at http://perma.cc/Y8G2-PNCB.
- 49Ryan Calo, Digital Market Manipulation, 82 Geo Wash L Rev 995, 1010 (2014).
- 50Id at 999. See also Ariel Ezrachi and Maurice E. Stucke, The Rise of Behavioural Discrimination, 37 Eur Competition L Rev 484, 485–89 (2016) (describing “behavioural discrimination” as the combination of price discrimination techniques and behavioral economics to exploit consumers’ cognitive biases to maximize firm profits by inducing consumers to make irrational purchasing decisions).
- 51See, for example, Mas-Colell, et al, Microeconomic Theory at 384–87 (cited in note 8); Varian, Intermediate Microeconomics at 439–49, 462–64 (cited in note 8). See also Arthur Pigou, The Economics of Welfare 279, 285 (Macmillan 4th ed 1932) (coining the term “price discrimination” and proposing the now-common three-degree classification system).
- 52See, for example, Mas-Colell, et al, Microeconomic Theory at 321 (cited in note 8); Varian, Intermediate Microeconomics at 292–94 (cited in note 8).
- 53See, for example, Mas-Colell, et al, Microeconomic Theory at 316–22 (cited in note 8); Varian, Intermediate Microeconomics at 292–94 (cited in note 8).
- 54See note 36.
- 55See Figure 1B.
- 56See Figure 1C.
- 57There are additional distributional implications for the consumer side of the market. Consumers with a higher WTP, who would have purchased the product at the (no discrimination) monopoly price, suffer an affirmative loss, as they pay more for the same product. Consumers with a lower WTP are not affected—without price discrimination they would have been priced out of the market, and with price discrimination they still get a zero (net) surplus. Budget constraints and wealth effects, see note 39, add nuance to this analysis: If WTP is smaller than the preference-based benefit, then perfect price discrimination, while hurting consumers with a high WTP, affirmatively helps consumers with a low WTP. And if WTP is positively correlated with wealth, then perfect price discrimination results in progressive redistribution.
- 58See, for example, Mas-Colell, et al, Microeconomic Theory at 384–86 (cited in note 8); Varian, Intermediate Microeconomics at 458 (cited in note 8).
- 59See Figure 2B. The overestimation inflates demand and thus increases the quantity sold. The higher price somewhat tempers this quantity-increasing effect but cannot reverse it.
- 60See Figure 2C.
- 61There are additional distributional implications for the consumer side of the market, especially if we add budget constraints and wealth effects. See note 39. Consumers with a high WTP, who would have purchased the product and gained a positive surplus in the absence of price discrimination, lose that positive surplus and more. Consumers with a low WTP, who would have been priced out of the market in the absence of price discrimination, now purchase the product and pay a price equal to their full WTP, including both the preference-based and misperception-based components. But as I note above, without misperceptions, budget constraints may keep the WTP below the preference-based level; and with misperceptions, if the bias level is sufficiently low, the full WTP may still be below the preference-based level. Therefore, consumers with a low WTP may actually benefit from price discrimination. And if WTP is positively correlated with wealth, then perfect price discrimination may result in progressive redistribution. Still, as compared to the parallel effect in the standard model, misperception reduces the magnitude of any progressive redistribution. See note 39.
- 62The upward sloping–shaded triangle representing the efficiency loss in Figure 2C is identical to the upward sloping–shaded triangle in Figure 2A.
- 63See Figures 1A–1C.
- 64In the standard model, price discrimination has another efficiency advantage: By increasing the provider’s surplus, price discrimination increases the availability of products and services that require large fixed-cost investments (for example, a doctor may only move to a small town if she can extract more surplus through price discrimination). And consumers benefit from this increased availability as long as the price discrimination is not perfect. In the behavioral model, even if the price discrimination is not perfect, consumers will likely pay more than the product or service is really worth to them.
- 65See, for example, Steven Shavell, Foundations of Economic Analysis of Law 597 (Belknap 2004) (explaining that “[t]here is a vast multitude of ways of aggregating individual utilities into a measure of social welfare,” including some that are purely utilitarian and others that emphasize distributional equity, but that “no single way is endorsed under welfare economics”).
- 66See Kaplow and Shavell, 23 J Legal Stud at 669, 674–75 (cited in note 11).
- 67See notes 35–38 and accompanying text.
- 68See, for example, Protecting Consumer Privacy in an Era of Rapid Change: Recommendations for Businesses and Policymakers *i (Federal Trade Commission, Mar 2012), archived at http://perma.cc/L2JY-2CE4 (calling on companies to “[b]uild in privacy at every stage of product development,” “[g]ive consumers the ability to make decisions about their data,” and “[m]ake information collection and use practices transparent”); Natasha Singer, Why a Push for Online Privacy Is Bogged Down in Washington (NY Times, Feb 28, 2016), online at http://www.nytimes.com/2016/02/29/technology/obamas-effort-on-consumer-privacy-falls-short-critics-say.html (visited Nov 2, 2018) (Perma archive unavailable) (describing the blueprint for the Obama Administration’s Consumer Privacy Bill of Rights and obstacles to its implementation); Regulation 2016/679 of the European Parliament and of the Council of 27 April 2016 on the Protection of Natural Persons with Regard to the Processing of Personal Data and on the Free Movement of Such Data (General Data Protection Regulation), 2016 OJ L119 1 (May 4, 2016) (adopting new data privacy regulations for the European Union); Cedric Burton, et al, The Final European Union General Data Protection Regulation (Bloomberg, Feb 12, 2016), archived at http://perma.cc/6BQ5-48G7 (summarizing the GDPR’s drafting and adoption); Natasha Singer, Data Protection Laws, An Ocean Apart (NY Times, Feb 2, 2013), online at http://www.nytimes.com/2013/02/03/technology/consumer-data-protection-laws-an-ocean-apart.html (visited Nov 2, 2018) (Perma archive unavailable) (describing the divergence between recent US and EU privacy law reforms). See also Do Not Track (Electronic Frontier Foundation), archived at http://perma.cc/R5HK-CL4G (describing a promising initiative attempting to serve as a means for stemming the flow of data to sellers who wish to engage in price discrimination); David C. Vladeck, Digital Marketing, Consumer Protection, and the First Amendment: A Brief Reply to Professor Ryan Calo, 82 Geo Wash L Rev 159, 163–64 (2014) (detailing the Federal Trade Commission’s version of a “Do Not Track” initiative).
- 69See Bar-Gill, 44 J Legal Stud at 464–69 (cited in note 16).
- 70See Ben-Shahar, The Ethics and Regulation of Personalized Pricing at *28 (cited in note 17).
- 71For examples of recent work on personalized default rules, see Ariel Porat and Lior Jacob Strahilevitz, Personalizing Default Rules and Disclosure with Big Data, 112 Mich L Rev 1417, 1433–50 (2014) (observing that variable legal defaults may be more effective in changing citizen behavior); Cass R. Sunstein, Empirically Informed Regulation, 78 U Chi L Rev 1349, 1399 (2011) (“Other default rules are personalized, in the sense that they draw on available information about which approach best suits individuals, and potentially even each individual, in the relevant population.”).
- 72See Omri Ben-Shahar and Carl E. Schneider, More than You Wanted to Know: The Failure of Mandated Disclosure 3 (Princeton 2014) (noting the prevalence of disclosure mandates and arguing that they often fail to achieve their goal).
- 73Regulators around the world have already begun to experiment with personalized disclosure mandates. See Bar-Gill, Seduction by Contract at 37–40 (cited in note 43) (describing mandated personalized disclosure of credit card interest rate and minimum payment information). For an academic argument in favor of personalized disclosure mandates, see Porat and Strahilevitz, 112 Mich L Rev at 1422, 1474 (cited in note 71).
- 74The term “preference-based WTP” may be too narrow when wealth effects are considered. A more accurate term would be “pre-bias WTP.”
- 75The market for information goods is an example of a market in which per-unit production costs are low (or zero).
- 76The market for health insurance is likely an example of demand-deflating misperceptions, as consumers underestimate future health care costs.
- 77See Figure 4B. The underestimation deflates demand and thus decreases the quantity sold. The lower price somewhat tempers this quantity-decreasing effect but cannot reverse it.
- 78Figure 4C depicts a scenario in which QM < QC'. When the underestimation bias is larger, we can also get QC' < QM. But because QM' < QC' < QC in both scenarios, the qualitative comparisons remain unchanged.
- 79See Figures 1A–1C.