Testing for Trademark Dilution in Court and the Lab
Federal courts are currently split, even within particular districts, on the basic question of what a plaintiff must show to establish that a defendant’s conduct constitutes trademark dilution by blurring. Federal trademark law defines “dilution by blurring” as “association arising from the similarity between a mark or trade name and a famous mark that impairs the distinctiveness of the famous mark.” In construing this statutory language, a majority of courts have held that, to establish blurring, a plaintiff need only show that consumers associate the defendant’s mark with the plaintiff’s famous mark. These courts appear to assume that, to the extent that there is consumer association, this association alone will “impair[ ] the distinctiveness” of the famous mark. A minority of courts have held that the plaintiff must show both consumer association and that the consumer association “impairs the distinctiveness” of the famous mark. In this Article, we make three contributions to the current debate over what must be shown to establish dilution by blurring. First, we report the results of a set of experiments that reveal that the majority approach is fundamentally deficient. These experiments demonstrate that, even when consumers associate a junior mark with a famous senior mark, this association does not necessarily result in any impairment of the ability of the senior mark to identify its source and associations. Second, we set forth a new method for determining when association is likely to lead to impairment. This method, which we term the “association strength test,” evaluates changes in how strongly survey respondents associate a mark with its source or attributes upon exposure to a diluting stimulus. Third, we evaluate the current state of the art in trademark dilution survey methodology: response time surveys. These surveys purportedly show both consumer association and impairment. Through a set of experiments, we demonstrate that these surveys currently use the wrong control and are invalid. In light of our findings, we reflect more generally on the question of whether dilution by blurring ever occurs and on how the blurring cause of action may be reconfigured to better comport with courts’ intuitions about the true nature of the harm that the cause of action seeks to address.
Introduction
Trademark dilution is among the most elusive concepts in intellectual property law.1 In theory, dilution occurs when two companies use very similar or even identical trademarks in a manner that does not confuse consumers as to source. Indeed, for dilution to have any meaning as an independent basis for trademark infringement liability, consumers must be aware that the two marks refer to two different companies. The problem that trademark dilution hypothesizes is not confusion; instead, the problem is a form of cognitive obstruction—that is, that these consumers must “think for a moment”2 whenever they see one of the marks to determine to which company the mark refers.
This burden on cognition is thought to represent a harm to the prior, “senior” user of the mark. For example, if a Brooklynite opens a microbar called “Apple” in her neighborhood, it is highly unlikely that patrons will be confused into believing that the global high technology brand owns the bar and is leveraging its brand into the sale of artisanal cocktails. There is no consumer confusion as to source. But the concept of dilution asserts that the existence of the bar may nevertheless harm the famous global brand. When Brooklynites hear the term “Apple,” they will associate it with two different entities: Is it the high tech company (the senior user of the trademark) or the bar (the junior user)? As the legal theory goes, this dual association causes a “blurring” of the link between “Apple” and the Cupertino company. This “dilution by blurring” is understood somehow to damage the famous brand name by diminishing the immediacy with which consumers identify the brand name with its source and other preexisting associations.
The concept of trademark dilution is as controversial as it is vague. Trademark scholars are overwhelmingly critical of antidilution protection,3 which appears to grant in gross rights to owners of qualifying marks4 —such that Apple (the technology company) could use antidilution law to prevent nearly any subsequent user from adopting the term “apple” as a trademark even when no consumer confusion plausibly results. Commentators also question whether ostensibly diluting conduct causes any real harm. Professor Christine Haight Farley defies proponents to provide even a single concrete (and not hypothetical) example of a mark that has been significantly damaged because another firm has used that mark in a nonconfusing manner on different goods.5 Indeed, it is far from obvious how one establishes whether dilution even occurs—not just in a particular litigation, but whether it ever even occurs at all.6 How would one go about showing that the boîte in Brooklyn has harmed in any way the world-famous brand with which it shares a name? Judges too remain highly suspicious of antidilution law.
Making matters worse, federal courts are currently split on the basic question of what the plaintiff must show to establish that the defendant’s conduct constitutes blurring. Even within particular districts, such as the Southern District of New York, courts have adopted different standards.7 Federal trademark law states that “‘dilution by blurring’ is association arising from the similarity between a mark or trade name and a famous mark that impairs the distinctiveness of the famous mark.”8 In construing this language, a majority of courts have held that to establish blurring, a plaintiff need show only that consumers associate the defendant’s mark with the plaintiff’s famous mark.9 In other words, to win an injunction, Apple of Cupertino would need show only that patrons of the Brooklyn bar associate its name with the Cupertino company (even if there is no source confusion). These courts appear to assume that, to the extent there is association between the defendant’s and plaintiff’s marks, this association alone will impair the senior mark’s distinctiveness of source and other preexisting associations.10 We refer to this in what follows as the “mere association” standard. A minority of courts have held that the plaintiff must show both consumer association and that this consumer association impairs the senior mark’s distinctiveness of its preexisting associations.11 Here, Apple of Cupertino would need to show that the bar calls to mind the global brand and that this calling to mind somehow impairs the global brand’s distinctiveness. We refer to this as the “association plus impairment” standard.
The split among courts is surprising, and not just because the statutory language appears clearly to call for the association plus impairment approach. In the 2003 case Moseley v V Secret Catalogue,12 the Supreme Court explicitly stated, albeit in dicta, that “‘[b]lurring’ is not a necessary consequence of mental association.”13 The Court could not have been clearer: the mere fact that consumers associate the defendant’s mark with the plaintiff’s cannot, without more, establish blurring. The Court recognized that there are two different associative links at issue: the link between the defendant’s mark and the plaintiff’s mark, and the link between the plaintiff’s mark and its source and other preexisting attributes. The emergence of the former link does not necessarily impact the strength of the latter. And yet a majority of courts continue to accept evidence establishing mere association as sufficient evidence of blurring.
In this Article, we make three contributions to the current debate over the nature of dilution by blurring and what, empirically, must be shown to establish it in court. First, we report findings from a new set of experiments that confirm that the majority mere association approach is fundamentally deficient. In support of the Moseley Court’s dictum (and common sense), these experiments demonstrate that, even when consumers associate a junior mark with a famous senior mark, this association does not necessarily result in any impairment of the ability of the senior mark to identify and distinguish its source and other associations. The practical significance of our experimental results is that survey and other evidence showing merely that consumers associate the defendant’s mark with the plaintiff’s senior mark cannot be judged sufficient to establish blurring. All courts should require, as a minority of courts currently do, that the plaintiff also show that the association between the defendant’s and plaintiff’s mark impairs the latter’s distinctiveness of source and other attributes.
Second, we propose an approach that courts should take in determining whether association between the defendant’s and plaintiff’s marks is likely to lead to impairment. We suggest that courts should demand evidence that exposing consumers to the junior mark is likely to affect the strength of preexisting associations between the senior mark and the qualities or attributes to which it is linked. Those preexisting associations must first be identified. The plaintiff must then establish that exposure to the junior mark weakens the link between the senior mark and those preexisting associations. We develop and test a methodology, which we call the “association strength test,” for producing this evidence. Importantly, we find that even this method for detecting impairment produces mixed results. We find some evidence of impairment, yet extremely strong marks (on the order of MERCEDES for automobiles) still appear to be resistant to blurring.
Finally, we assess the validity of a possible rival methodology for establishing dilution. This is a new form of survey evidence taken from the marketing literature: experimental response time surveys. These surveys purportedly show both association and impairment and should therefore satisfy the association plus impairment standard. Though to our knowledge such surveys have not yet been used at trial, they represent the current state of the art in dilution research. Such studies expose treatment subjects to advertisements that ostensibly dilute certain targeted marks (for example, an advertisement for a fictitious brand called HEINEKEN popcorn), while control subjects are exposed to no such advertisements. The studies then compare the speed and accuracy with which the treatment and control subjects link various marks, including the targeted marks, with their respective sources and associations. The studies report that treatment subjects take longer to match the targeted marks with their true sources and associations and are also less accurate in doing so. Both effects are offered as evidence of impairment of distinctiveness—and more generally, contra Farley and other skeptics, as evidence that dilution by blurring is indeed real.14
We show, however, that the experimental protocols used in these leading response time experiments are fatally flawed. In short, they used the wrong control. We report the results of a second set of experiments, in which we expose both treatment subjects and control subjects to ostensibly diluting advertisements. The difference is that control subjects were exposed to ostensibly diluting advertisements for marks other than the targeted marks that were the focus of the test. When using this experimental design, we find that treatment and control subjects produce no significant differences in the accuracy or speed with which they link various marks with their respective sources and associations. We suggest that when test subjects are exposed to any diluting stimuli in the form of a brand-product linkage that is unfamiliar to them (for example, NIKE toothpaste), test subjects become wary and cautious, which increases their response times and impacts their accuracy in linking tasks. When this wariness or surprise is controlled for, no evidence of blurring is found.
Our findings here have both practical and theoretical significance. As a practical matter, we set forth a valid means of establishing that the association between a defendant’s mark and a plaintiff’s mark impairs the distinctiveness of the latter. Furthermore, we show that if response time studies are used in litigation, they must use the correct control. They must expose treatment subjects to ostensibly diluting stimuli that target the mark at issue in the litigation and control subjects to such stimuli that target other marks that bear no relation to the mark at issue but that may nevertheless be surprising or unfamiliar. As a theoretical matter, our findings suggest that the best evidence we have of dilution by blurring remains, at best, very weak. This is alarming. Congress passed the first federal antidilution law in 1995, which was a poorly drafted failure, and replaced it entirely in 2006.15 Many states have had antidilution statutes for decades.16 Countless court opinions have addressed a dilution cause of action. Yet at present, there is still no persuasive empirical demonstration that conclusively shows that any appreciable degree of dilution by blurring ever actually occurs. Congress and the courts have devoted an enormous amount of effort to regulating a harm that remains essentially hypothetical.
Part I reviews surveys currently used in dilution litigation that show mere association and reports the results of our experiments demonstrating that such surveys do not necessarily show impairment of distinctiveness and, as such, do not show blurring. Part I also presents our association strength test. Part II reviews current response time studies and reports the results of our experiments showing that they are incorrectly designed and invalid. Part III briefly discusses the general implications of our findings for the question of what dilution is and whether it even occurs. We consider in particular the possibility that the theory of dilution by blurring remains such an unsubstantiated jumble because courts have seized upon antidilution protection as a means to prevent something else: misappropriation. This Article concludes by considering future directions for research.
I. Mere Association and Blurring
As we mention briefly above, a majority of courts that have considered an antidilution claim have adopted the mere association standard for establishing blurring. That is, they have accepted survey evidence that consumers merely associate the plaintiff’s and defendant’s marks as sufficient evidence to show that the defendant’s mark “impairs the distinctiveness” of the plaintiff’s mark. And in certain leading cases, courts have based their finding of blurring on survey evidence showing a likelihood of consumer confusion as to source. In Part I.A, we review these forms of survey evidence and explain why, even on their own terms, they fail to establish blurring. We then present in Part I.B the results of a set of experiments that confirm the insufficiency of evidence of mere association. In Part I.C, we propose a means of empirically demonstrating impairment of distinctiveness.
A. Survey Evidence of Mere Association
Those courts that apply the mere association standard generally rely on two forms of survey evidence as proof of blurring. We review them in turn.
1. The Nikepal survey approach.
The first and most prominent form of survey evidence that mere association courts have accepted consists of variations on the survey method used by the plaintiff in Nike Inc v Nikepal International Inc.17 In Nikepal, the defendant used the mark NIKEPAL as the name of its business distributing glass syringes and other laboratory products.18 Nike conducted a telephone survey of the defendant’s current and prospective customers in which it asked them about “their perception of a website called nikepal.com.”19 Specifically, the survey asked: “What if anything, came to your mind when I first said the word Nikepal?” Unsurprisingly, 87 percent of respondents stated that they thought of the plaintiff or its products. The survey expert and the Nikepal court took this as evidence of blurring.20 Other courts have accepted the results of similar surveys as evidence of blurring.21
The Nikepal court did not explain how mere association translates into evidence that use of NIKEPAL impairs the distinctiveness of the NIKE mark. Numerous trademark commentators have criticized the Nikepal survey method as failing to present persuasive evidence of dilution,22 and we believe these criticisms are valid. Nike is one of the world’s best known brand names. The fact that a consumer thinks of a famous mark when she sees a word containing that mark may not mean that the distinctiveness of the famous mark is “blurred” or harmed in any way. Indeed, because the association calls the famous mark to mind, its strength and salience may conceivably be reinforced.23 Each time a Brooklynite goes into that Apple bar, she may be reminded that Apple, the iPhone maker, is a leading technology company. The measure used in the Nikepal case cannot tell us which of the outcomes is more likely and, for that reason, lacks construct validity; that is, it cannot be taken as a valid measure of harm.
The marketing literature is very clear on how a brand suffers harm. Marketers would describe harm to a brand (or trademark) as a diminution of (customer-based) brand equity.24 Professor Kevin Lane Keller characterizes brand awareness and brand image as the components of customer-based brand equity.25 Brand image in turn is built from strong, favorable, and unique brand associations. Damage caused by blurring conceptually fits into this framework as a weakening of brand associations, a compromise of the uniqueness of the associations, or a reduction in the favorability of the associations the trademark owner has worked hard to cultivate.26 The Nikepal approach cannot indicate that an association is tied to brand weakening and as such is not probative of blurring.
2. Association and confusion survey results.
Courts have also relied on likelihood of confusion surveys as evidence of dilution by blurring. For example, in Jada Toys, Inc v Mattel, Inc,27 Mattel, which manufactured toy automobiles under the HOT WHEELS mark, argued that Jada Toys’s sale of toy automobiles under the HOT RIGZ mark would both confuse consumers and blur Mattel’s mark.28 Mattel proffered two confusion surveys.29 The first exposed respondents to the HOT RIGZ mark and then asked a series of questions designed to determine who the respondents believed “puts out or makes” toy vehicles with that name.30 The second survey exposed respondents to a HOT RIGZ package and asked similar questions.31 In reversing the district court’s partial grant of summary judgment to Jada Toys, the Ninth Circuit Court of Appeals pointed to both surveys as “significant evidence of actual association between the alleged diluting mark and the famous mark”32 and found that a “reasonable trier of fact could conclude that this evidence was sufficient to establish the existence of a likelihood of dilution.”33 The Second Circuit Court of Appeals has more recently written approvingly of the Jada Toys court’s reasoning and reliance on confusion survey evidence as potential evidence of dilution, stating that “[s]ource confusion may be probative of association.”34
As with the Nikepal survey format, consumer confusion surveys show consumer association, but they do not show blurring. Indeed, confusion surveys arguably show the opposite of blurring. Recall that blurring describes situations in which, due to the similarity of the plaintiff’s and the defendant’s marks, consumers see the plaintiff’s mark and must think for a moment to determine whether the mark is referring to the plaintiff or the defendant—APPLE for the high-technology company or for the bar in Brooklyn. In this scenario, consumers are not confused as to source. They know that APPLE may refer to one of two different companies. By contrast, consumer confusion surveys expose situations in which consumers believe that both marks, due to their close similarity, refer only to the plaintiff. In this sense, the defendant’s mark reminds consumers of and reinforces the link between the plaintiff’s mark and the plaintiff. Consumers do not think that there are two different companies. They think that there is only APPLE, the famous high-technology company that has now apparently expanded its brand into cocktail bars.
In other words, in the case of consumer confusion, on encountering the defendant’s mark, the confused consumer associates it with the plaintiff’s mark and believes that it originates in the plaintiff. By contrast, in the case of blurring, on encountering the defendant’s mark, the blurred consumer associates it with the plaintiff’s mark but knows that it originates in the defendant. Evidence of consumer association that leads to consumer confusion is evidence that consumers think there is only one company rather than two; those confused consumers cannot experience blurring because they associate both marks with the same company.
On these grounds, many commentators have been critical of courts’ conflation of evidence of association that leads to confusion with evidence of association that leads to blurring.35 This conflation risks merging confusion and dilution, which are two very different causes of action.36 Yet plaintiffs, it seems, are only too eager to confuse the matter and, having conducted a confusion survey, present its results as evidence of blurring as well.
B. Survey Evidence of Mere Association Is Not Evidence of Impairment
We believe, as the Moseley Court stated, that mere association evidence fails on its own terms to establish blurring. But we also present experimental evidence confirming that even when consumers associate a junior mark with a senior famous mark, this does not necessarily result in weakening the association of the famous mark with its source or other associations. Furthermore, such consumer association does not necessarily result in any material change to consumers’ purchasing preferences. In sum, mere association on its own does not necessarily damage the senior mark.
1. Brand selection pretest.
Because we intended in these experiments to study blurring in the form of changes in brand associations, we sought out brands with strong, relatively well-defined associations. We chose automobiles as a product category and collected data from five hundred people to identify brands and associations that could potentially be blurred.37 The research began by showing respondents the names of up to twenty popular car brands. The brand names were shown one by one in random order. For each brand name, respondents were asked whether they were familiar with the brand. Familiarity with the brand was defined as knowing something about it other than that it exists. Respondents responded “yes” or “no.”
As soon as a respondent identified five familiar brands, we stopped showing that respondent brands and moved on to the next phase. In this second phase, respondents were asked to name the top five things that came to mind when they thought of each of the brands they identified as familiar; that is, the top five associations for each brand. Our assumption was that very strong brands would bring to mind a relatively concentrated set of associations, most of which would be positive. Conversely, weaker brands would bring to mind a larger set of more diffuse, and sometimes negative, associations.
To determine how concentrated a brand’s associations were, we collected all of the associations that respondents provided for each brand. We then grouped like associations and calculated the percentage of subjects identifying each group. We then added up the percentages for the five most common association groups mentioned for each brand. This gave us a concentration score. The mean concentration score was 39 percent. We considered a brand “strong” if its concentration score was at least one standard deviation above the mean.
This left us with Mercedes (57.41 percent), BMW (55.92 percent), and Infiniti (48.34 percent) as our three strongest brands. Coincidentally, all three brands are luxury car brands. Respondents tended to emphasize this fact most when asked to list words they associate with each mark. In all three cases, the most common associations named were characteristics like “luxury,” “expensive,” as well as words that connote wealth and high socioeconomic status. Respondents also associated words like “fast” and “good looking” with the Mercedes, BMW, and Infiniti brands, but to a lesser extent.
We first selected MERCEDES because it had the highest concentration score. For our second test brand, we chose INFINITI. INFINITI had a relatively high concentration of positive associations, but it was among the least familiar brands in our sample. In fact, only 41.1 percent of respondents who saw an INFINITI prompt said they knew something about the brand other than that it existed. By comparison, 60.8 percent of respondents who saw a MERCEDES prompt and 63.8 percent of respondents who saw a BMW prompt said that they knew something about those brands. As such, although INFINITI has relatively clear associations among those who are familiar with it, it may be more easily diluted because its associations are not as widely held.
2. Study 1: Examining brand association strength.
Study 1 tested whether blurring advertisements affected the strength of the association between the MERCEDES and INFINITI brands and both their product category (cars) and the top associations (wealth, luxury) previously found for each brand in our initial brand selection pretest. A total of 2,012 subjects participated in the experiment. Each subject was randomly assigned to a brand (MERCEDES or INFINITI), then randomly assigned to a treatment or control group. The 503 subjects in the INFINITI control group and the 506 subjects in the MERCEDES control group saw three “filler” text-only “tombstone” advertisements for well-known brands (for example, PERRIER sparkling water, CHASE bank, UNITED VAN LINES) that contained true representations of each brand’s product category and attributes.38 Subjects in our two treatment groups saw the three filler ads plus an ad for a fictitious diluting brand. The 505 subjects assigned to the MERCEDES treatment group saw an ad for a diluting brand called “MERCEDES Toothpaste” and the 498 subjects assigned to the INFINITI treatment group saw an ad for a diluting brand called “INFINITI Toothpaste.”39
All subjects were then shown twenty-three brand-word pairs and told to state the degree to which they associate the brand name and the word on a five-point Likert scale,40 on which a score of one means they associate the brand and the word “a great deal” and a score of five means they associate the brand and the word “not at all.” Eighteen of these pairs were filler pairs for brands unrelated to cars, such as CHASE-money, CHASE-food, COCA COLA-thirst, COCA COLA-expensive, NIKE-slow, NIKE-poor, UNITED-plane, and UNITED-boxes. Randomly mixed in with the eighteen filler pairs were five brand-word pairs for one of our target marks. The pairs for our target marks included the product category “cars” and two words that capture the high-status qualities that respondents in our brand selection survey tended to associate with both marks: “luxury” and “wealth.” Finally, we included two words that are not associated with the Mercedes and Infiniti car brands: the product category “toothpaste” and the attribute “cheap.” Subjects in the MERCEDES group therefore saw the pairs MERCEDES-cars, MERCEDES-wealth, MERCEDES-luxury, MERCEDES-toothpaste, and MERCEDES-cheap randomly distributed among the eighteen filler pairs. Subjects in the INFINITI group saw INFINITI-cars, INFINITI-wealth, INFINITI-luxury, INFINITI-toothpaste, and INFINITI-cheap mixed in with the eighteen filler pairs.
If the MERCEDES and INFINITI Toothpaste ads were causing dilution by blurring, we would expect that subjects in the treatment groups exposed to such ads would show two differences from subjects in the control group. First, as compared to control subjects, treatment subjects would more strongly associate the car brands with the product category “toothpaste.” Second, treatment subjects would less strongly associate the car brands with the product category “cars.” They may also become less likely to associate these marks with words that our pretests indicated to be strongly associated with MERCEDES and INFINITI, such as “luxury” and “wealth,” and more likely to associate these brands with the word “cheap,” which better describes an ordinary, low-cost product like toothpaste than an expensive luxury automobile. Such differences would indicate that distinctiveness has been impaired.
We present the results of Study 1 below. We first report average treatment effects (that is, the average of the Likert responses of the treatment subjects minus the average of the Likert responses of control subjects). These show no blurring. We then describe shifts in the distribution of responses of treatment subjects as compared to control subjects. These results present a more complicated picture.
a) Average treatment effects. Table 1 sets out average treatment effects. These results show that our blurring stimulus produced a new association—that is, an association between MERCEDES or INFINITI, and toothpaste—for a significant number of subjects. Specifically, the average treatment effect of the diluting toothpaste ad was 0.369 on a five-point scale in the case of MERCEDES and 0.730 on a five-point scale in the case of INFINITI. Both effects are statistically significant (p < 0.01), and they remained significant in regressions that controlled for subjects’ stated level of familiarity with the MERCEDES and INFINITI brands, which we asked about at the end of the interview.
Crucially, Table 1 shows no evidence that this new association between the test brands and the toothpaste product category is accompanied by a weakening of the association between the test brands and their true product category or their principal product attributes. Subjects who saw the MERCEDES Toothpaste and INFINITI Toothpaste ads were no less likely than control group subjects to associate target marks with the product category “cars” or attributes like “luxury” and “wealth.” Furthermore, subjects who saw the MERCEDES Toothpaste and INFINITI Toothpaste ads were no more likely than control group subjects to associate these brands with the word “cheap.” In short, Table 1 shows no evidence of distinctiveness having been impaired.
| Treatment Group: Mercedes/Infiniti Toothpaste Ad | |||||||||
|---|---|---|---|---|---|---|---|---|---|
| Control Group: No Fourth Ad | |||||||||
| Mercedes-Luxury | Mercedes-Wealth | Mercedes-Cars | Mercedes-Toothpaste | Mercedes-Cheap | Infiniti-Luxury | Infiniti-Wealth | Infiniti-Cars | Infiniti-Toothpaste | Infiniti-Cheap |
| 0.052 | 0.019 | 0.040 | −0.369*** | −0.016 | −0.009 | 0.124 | 0.055 | −0.730*** | −0.029 |
| (0.050) | (0.059) | (0.040) | (0.048) | (0.032) | (0.078) | (0.081) | (0.075) | (0.058) | (0.043) |
| Standard errors in parentheses Two-tailed test: ** p < 0.05, *** p < 0.01 |
|||||||||
b) Shifts in distributions of Likert responses. Looking only at average treatment effects can obscure important changes in the distribution of responses to each of the brand-word pairs. These distributions, presented in Figures 1 and 2, tell a more nuanced story.
First, consistent with Table 1, the top-left and bottom-left cells of Figure 1 show that subjects who saw a MERCEDES Toothpaste or INFINITI Toothpaste ad (the treatment groups) were more likely to associate these marks with the product category “toothpaste” compared to control group subjects who did not see a diluting ad. Almost all control group subjects (94.0 percent and 95.7 percent) said they do “not at all” associate the INFINITI or MERCEDES brand with the word “toothpaste” (that is, they responded with a “five” on a five-point Likert rating scale). The result was very different for subjects in the treatment groups. In the INFINITI treatment group, 54.8 percent of subjects said they do “not at all” associate INFINITI with the word “toothpaste,” whereas 23.5 percent said they associate these words “a little,” 9.2 percent “a moderate amount,” 6.2 percent “a lot,” and 6.2 percent “a great deal.” In the MERCEDES treatment group, 73.3 percent of subjects said they do “not at all” associate the words MERCEDES and toothpaste, whereas 15.8 percent associate them “a little,” 5.0 percent “a moderate amount,” 2.8 percent “a lot,” and 3.2 percent “a great deal.” These differences ought to be attributable to the fact that treatment group subjects saw an ad moments earlier that established an association between these brands and the toothpaste product category.
Figure 1: Distribution of Responses by Brand and Product Type
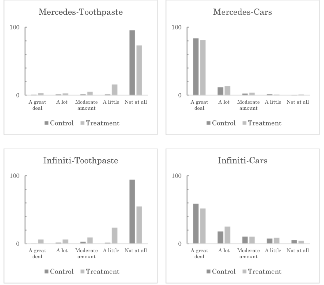
The top-right and bottom-right cells of Figure 1 show how subjects in the treatment and control groups responded when asked the degree to which they associate the MERCEDES and INFINITI brands with the product category “cars.” Here we see some evidence, although it is far from definitive, that the toothpaste ads weakened the association between the senior marks and their product category. In the case of MERCEDES, the more famous of our two brands, any impairment or weakening of the association with the product category appears to be negligible. Among control group subjects, for instance, 83.79 percent said they associate MERCEDES with the word “cars” “a great deal,” 11.86 percent said they associate these words “a lot,” and 2.37 percent said they associate them “a moderate amount.” In the treatment group, 81.19 percent said they associate MERCEDES with cars “a great deal,” 13.47 said “a lot,” and 3.56 percent said “a moderate amount.” In both groups, the association between MERCEDES and cars was very strong; however, it appears that it was slightly less strong in the case of the treatment group. A chi-square test for equality of distributions indicates that these differences approach (but fall short of) standard thresholds for statistical significance (x2 = 9.22; p = 0.056).
Evidence that the toothpaste ad caused a weakening of the association between the brand and product category is substantively larger and statistically significant in the case of INFINITI, the lesser known of the two car brands. Among control group subjects, 58.65 percent said they associate INFINITI with the word “cars” “a great deal,” and 18.09 percent said they associate INFINITI with cars “a lot.” Among treatment group subjects, the percentage who said they associate INFINITI with cars “a great deal” was lower at 51.81 percent, while the percentage who said they associate INFINITI with cars “a lot” was higher at 25.1 percent. The distribution, in other words, shifts slightly to the right in the treatment group. A chi-square test indicates that these differences are statistically significant (x2 = 16.87; p = 0.002). Again, both groups strongly associate INFINITI with the word “cars”; however, the group that saw the INFINITI Toothpaste ad was somewhat less enthusiastic in making that connection. It therefore seems that the diluting ad caused a slight weakening of the association between INFINITI and cars.
Figure 2: Distribution of Responses by Brand and Product Attribute
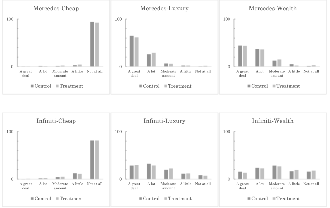
Figure 2 shows the distribution of responses to questions about product attributes, such as “wealth” and “luxury,” and the word “cheap,” which one might associate with an everyday product like toothpaste. These distributions show what looks like a slight weakening of the association on the MERCEDES-luxury and INFINITI-wealth pairs. These differences, however, are both substantively very small and not statistically significant (p = 0.211; p = 0.220). Overall, we do not find evidence that the toothpaste ad caused a weakening of common associations or that it caused people to associate the brand names with the word “cheap.”41
In sum, the MERCEDES and INFINITI Toothpaste ads contributed to the formation of a new association between the targeted brands and a new product category. Evidence of this was straightforward both when we analyzed average treatment effects and when we compared the distribution of subjects’ responses. While we observed the formation of a new association among subjects in the treatment groups, we found mixed evidence that the creation of this new association was accompanied by the blurring or weakening of preexisting associations. Comparing average responses, there were no statistically significant differences between the degree to which subjects in the treatment and control groups associated certain words with the target brands. A closer look at the distribution of responses was more nuanced. Particularly with regard to the INFINITI-cars pairing, our analysis of the response distributions indicates that the diluting ad may have caused a slight weakening of the association between INFINITI and cars. The data here is far from definitive—especially given the results of Study 2, which we discuss directly below. But it does point toward a method, which we term the association strength test, that courts can use to determine whether association leads, in a particular case, to dilution. We will return to that point in Part I.C below.
3. Dilution and brand ranking.
Study 1 shows that new associations may or may not lead to the weakening of other associations, but the ultimate question as to whether distinctiveness is impaired is whether these new associations have some effect on the “selling power” of the famous brand. Study 2 engaged this issue. It tested whether ostensibly blurring advertisements and the new associations they produce affect consumer preferences and consumers’ intent to purchase the targeted brand.
| Treatment Group: Mercedes/Infiniti Toothpaste Ad | |
|---|---|
| Control Group: No Fourth Ad | |
| Mercedes | Infiniti |
| 0.178 | 0.048 |
| (0.170) | (0.249) |
| Standard errors in parentheses Two-tailed test: ** p < 0.05, *** p < 0.01 |
|
Study 2 consisted of a preference-ordering protocol in which 1,009 subjects were first shown up to twenty car brands in random order and asked to state whether the brand was familiar. When five familiar brands were selected, respondents moved to the next stage of the experiment. Half of the subjects who said they were familiar with either MERCEDES or INFINITI were shown a diluting MERCEDES Toothpaste or INFINITI Toothpaste ad in addition to three filler ads (treatment group). The other half were shown a NIKE Toothpaste ad in addition to the three filler ads (control group).42
After viewing the ads, subjects were asked to rank the five brands they had identified as familiar in order of preference, from 1 (favorite) to 5 (least favorite). Overall, the mean rank for MERCEDES was 2.32, and the mean rank for INFINITI was 2.84.
Table 2 shows the differences between the mean preference ranking for treatment and control group subjects for each brand. In both cases, the differences are not statistically different from zero. We are unable to find any evidence from this protocol that the diluting ad caused subjects to rank MERCEDES or INFINITI lower.
C. Moving Forward: What Courts Should Require Dilution Plaintiffs to Prove
To recall, federal trademark law states that “‘dilution by blurring’ is association arising from the similarity between a mark or trade name and a famous mark that impairs the distinctiveness of the famous mark.”43 This statutory language implies that some associations do not impair the distinctiveness of the plaintiff’s mark. Otherwise, if all association resulted in impairment, there would be no need to add the limiting phrase “that impairs the distinctiveness of the famous mark.” The statutory scheme assumes an underlying fact: association does not necessarily lead to impairment.
Taken together, Studies 1 and 2 suggest that courts that equate mere association with impairment—in defiance of the Moseley Court’s dictum—are proceeding in error. We exposed subjects to diluting stimuli that created new associations among the targeted brands and new products and brand characteristics in these subjects’ shared associative memory networks.44 But despite the new associations, we found no evidence of blurring measured either by average treatment effects or by effects on purchase intention. That is, as measured by average treatment effects, subjects showed no weakening of the association between the targeted brands and their traditional products and characteristics, nor did these subjects reveal any change in purchasing preferences.
In contrast, when we disaggregated average treatment effects and examined the distribution of responses on our five-point Likert scale, we saw some results that suggest the potential for dilution. For example, we saw a statistically significant shift in the number of subjects responding “a great deal” when asked whether they associated INFINITI with the product category “cars” and a corresponding increase in subjects responding “a lot” to that question (a response indicating a slightly weaker connection). On the other hand, we did not see the same sort of significant shift in the distribution of preferences for MERCEDES. That fact is important because even our best evidence for impairment is significant for only one of the two brands. What we see, in short, is a glimmer of evidence that association may be associated with dilution. But we see strong evidence that association does not lead inexorably to dilution.
On this basis, we conclude that courts should not treat mere association as tantamount to proof of trademark dilution through blurring. Plaintiffs must present something more than evidence of association between the defendant’s and plaintiff’s marks to establish the likelihood that the plaintiff’s mark will suffer dilution via blurring.
The question, of course, is what plaintiffs should do to present proof of dilution aside from evidence of the mere fact of association between the defendant’s and plaintiff’s marks. We believe that our results help to mark the correct path. Courts should require plaintiffs to produce evidence of a weakening of the associations between the plaintiff’s mark and its source or other preexisting attributes. Plaintiffs may seek to do so by using our Study 1 and Study 2 methodologies. Study 1 is a direct measure of any such impairment. Data from this type of study should be analyzed to see both whether exposure creates a negative average treatment effect and also whether it changes the distribution of Likert responses in a way that suggests impairment. As a supplement, Study 2 indirectly measures association strength. It does so by inquiring whether the association of a defendant’s junior mark with the plaintiff’s senior mark “cashes out” in the form of reduced consumer intention to purchase the plaintiff’s goods. In the end, this is the form of harm that brand owners typically care about most because it hits their bottom line. Though the results of one test may sometimes be sufficient to show impairment, courts would be best advised to rely on a combination of these tests and to be wary of enjoining defendants based on weak and conflicting evidence of dilution—such as when (as in our studies) the data reveals no substantial negative average treatment effect or diminution in purchase intention but rather only small shifts in the distribution of Likert responses. Ultimately, the plaintiff should be required to demonstrate that any weakening of association between the plaintiff’s mark and its source or preexisting attributes (or any reduction in purchase intention) is not just statistically significant but also substantively significant. Evidence that the defendant’s mark only slightly impairs the distinctiveness of the plaintiff’s mark cannot justify the kind of broad injunctive relief that antidilution protection entails.
In sum, we have identified empirical tests for dilution that have construct validity. And yet nothing we have done relieves courts of their central responsibility in assessing this sort of social scientific evidence—a court must always take care to assess the strength of the evidence produced by the tests and not simply rely blindly on a positive and statistically significant result.
II. Response Time Experiments and Blurring
The association tests we discuss above are not the only tools available to litigants and courts involved in a dilution dispute. Over the last two decades, social science research has developed tests for blurring based on response time measurements, and these tests have begun to penetrate ongoing litigations. Unlike mere association surveys, response time tests purportedly show disassociation in that subjects exposed to ostensibly diluting stimuli appear to take longer than control subjects to link targeted marks with their traditional product categories and product attributes and characteristics. In this Part, however, we show that previous versions of these tests were flawed. When response time tests use the proper control, no evidence of dilution is found. We first review these previous experiments. We then report the results of our own response time experiments and explain their significance.
A. Previous Response Time Experiments
We focus on two response time studies: Professors Maureen Morrin and Jacob Jacoby’s pathbreaking 2000 study, Trademark Dilution: Empirical Measures for an Elusive Concept,45 and Professors Chris Pullig, Carolyn Simmons, and Richard Netemeyer’s influential 2006 study, Brand Dilution: When Do New Brands Hurt Existing Brands?46
1. Morrin and Jacoby.
Morrin and Jacoby set out to test the hypothesis that “[c]onsumers exposed to trademark-diluting advertisements will (a) commit more brand recognition errors and (b) exhibit slower brand recognition reaction times than will consumers not exposed to such advertisements.”47 Their method was straightforward (and served as a model for our own Pilot Studies A and B and Study 3, all discussed below). They exposed sixty-four subjects each to a total of six “tombstone” text advertisements, some of which were ostensibly diluting of three target brands (HEINEKEN, HYATT, and GODIVA) and then recorded the speed and accuracy with which the subjects attempted to match the target brands with their product categories and characteristics.48
The treatment group consisted of thirty-three subjects who viewed three text-only “filler” advertisements for well-known brands that contained true representations of each brand’s product category and attributes (for CHASE, KODAK, and PERRIER), one blurring advertisement, one tarnishing advertisement,49 and one brand extension advertisement.50 The blurring advertisement took the form of an advertisement for either HEINEKEN popcorn or HYATT legal services. Each blurring advertisement contained a disclaimer stating either that “[HEINEKEN] popcorn is NOT associated with the makers of Heineken beer” or that “[HYATT] legal services is NOT associated with Hyatt Hotels, Inc.”51 The tarnishing advertisement was for DOGIVA dog biscuits and contained no disclaimer with respect to GODIVA. The brand extension advertisement was for either HEINEKEN popcorn or HYATT legal services—whichever was not used in the blurring advertisement—and apparently contained language announcing the brand extension.52
One control group consisted of sixteen subjects who were exposed to the three filler advertisements and to three unrelated advertisements. A second control group consisted of fifteen subjects who were exposed to the three filler advertisements and three reinforcing advertisements for HEINEKEN beer, HYATT hotels, and GODIVA chocolate.53
Immediately after viewing the six advertisements, subjects engaged in a computer task in which two words appeared sequentially on a screen. Subjects were instructed to indicate as quickly but as accurately as possible whether the two words “represented a match” by hitting one key for “Yes” or another for “No.”54 Among the word pairs presented were pairs relating to category membership (for example, GODIVA/chocolates, chocolates/GODIVA) and attribute possession (for example, GODIVA/rich taste, rich taste/GODIVA).55
Morrin and Jacoby reported that the mean response times of the treatment group were significantly higher than those of either control group, but only with respect to matches relating to HEINEKEN and GODIVA and not with respect to matches relating to HYATT. For matches relating to HEINEKEN and GODIVA taken together, treatment subjects’ mean response time was 836 milliseconds while it was 672 milliseconds for the control group exposed to reinforcing advertisements and 713 milliseconds for the control group exposed to unrelated advertisements.56 Meanwhile, for matches relating to HYATT, the treatment group’s mean response time was 680 milliseconds, which was exactly the same as the reinforced control group’s mean response time and substantially less than the unreinforced control group’s mean response time of 810 milliseconds.57 Morrin and Jacoby further reported that the treatment group’s matching accuracy was lower than both control groups and that this difference was statistically significant.58 Specifically, the treatment group accurately judged 73.1 percent of the matches, while the unreinforced control group and the reinforced control group accurately judged 84.3 percent and 88.9 percent of the matches, respectively.59
As Morrin and Jacoby saw it, these results fully supported the hypothesis that consumers exposed to diluting advertisements will commit more brand recognition errors but only partially supported the hypothesis that such consumers will react more slowly to brand recognition tasks. They speculated that subjects’ increased familiarity with the HYATT brand moderated the effect on response times for the HYATT legal services advertisement. The authors conducted a subsequent study that tested consumers’ ability after exposure to diluting stimuli to recall the categories of goods in connection with which certain brands were used.60 The study tested both well-known and unknown brands. Based on the results of this study, Morrin and Jacoby concluded, “It appears that very strong brands are immune to dilution because their memory connections are so strong that it is difficult for consumers to alter them or create new ones with the same brand name.”61 This conclusion, if correct, carries with it significant public policy implications because federal antidilution law is designed to protect only “famous” brands (that is, those that are “widely recognized by the general consuming public of the United States”).62
2. Pullig, Simmons, and Netemeyer.
Now armed with a methodological paradigm, subsequent response time research addressed the next logical question: Under what conditions would we expect dilution to be more likely to occur? Pullig, Simmons, and Netemeyer built on the Morrin and Jacoby approach to address this question by investigating potential moderators of trademark dilution.63 In particular, they were interested in whether the similarity between the categories and attributes of the senior and junior users moderated the threat of dilution by blurring.
Pullig, Simmons, and Netemeyer’s experimental protocol was complex and need not be described in detail here. In essence, they focused on BIG RED, a brand of chewing gum reasonably well-known in the United States for having a cinnamon flavor, and used a hypothetical BRAND A as a control. To study the effect of category similarity, they exposed eighty-nine subjects to a total of three advertisements according to a “2 (category similarity: high [bubble gum] or low [snack bars]) x 2 (new product: junior brand [BIG RED] and unbranded [BRAND A]) x 2 (order of ad presentation) between-subjects design.”64 More specifically, one advertisement was for bubble gum (branded as either BIG RED, BRAND A, or BAZOOKA), one was for bite-size candy (branded as SKITTLES), and one for snack bars (branded as either BIG RED, BRAND A, or NUTRI-GRAIN). Each advertisement contained the brand name, a product category, and two claims. To hold constant attribute similarity, certain bubble gum and snack bar ads claimed “great cinnamon flavor.”65 The BIG RED bubble gum advertisement also promised to “blow awesome bubbles,” while for the BIG RED snack bars advertisement, the other claim stated “enriched with vitamins and minerals.”66
After viewing the advertisements, subjects engaged in a computer-administered task. The subject was presented with a brand name or attribute, and after pressing the space bar, an attribute or brand name (depending on what was presented first) appeared. The subject then pressed a key as quickly but as accurately as possible to indicate whether the brand name and attribute matched.67
Pullig, Simmons, and Netemeyer reported that subjects exposed to the use of BIG RED in the similar product category (bubble gum) exhibited significantly faster response times linking BIG RED and chewing gum and linking BIG RED and cinnamon flavor than subjects exposed to BRAND A bubble gum. The mean change in speed ranged from an increase of 174 milliseconds to an increase of 327 milliseconds. These results suggested that junior users in a similar product category reinforce rather than blur the senior mark.68
By contrast, subjects exposed to the use of BIG RED in the different product category (snack bars) exhibited significantly slower response times than subjects exposed to BRAND A snack bars. Here the mean change ranged from a decrease of 119 milliseconds to a decrease of 334 milliseconds. These results suggested to the authors that junior users in a different product category blur the mark.69
In a second study, Pullig, Simmons, and Netemeyer manipulated both category and attribute similarity. Their protocol was based on that of the previous study but with an additional dimension varying attribute similarity between high, “cinnamon flavor and breath freshening,” and low, “strawberry flavor and containing immunity-boosting Echinacea.”70 Their response time results suggested to them that a junior user in a similar product category with similar product attributes reinforces the senior user’s mark. On the other hand, a junior user in a different product category with different attributes blurs the senior mark. However, the response time results were otherwise mixed and suggest that attribute similarity may sometimes offset category dissimilarity and forestall blurring.71
B. Response Time Pilot Studies: Are We Really Observing Dilution?
A leading criticism of the Morrin and Jacoby study in particular, and to some extent of the Pullig, Simmons, and Netemeyer study, is that they failed to place their test subjects in a purchasing context. Professor Rebecca Tushnet has persuasively argued that consumers are sophisticated enough to disambiguate terms in light of context.72 For example, at an airport, when someone refers to “United” or “Delta,” no one must “think for a moment” to know that the references are to airlines and not to the Manchester soccer club or the faucet maker. Even in a setting like online search, in which there is less context, consumers are often able to disambiguate various uses of a mark using the information that accompanies search results.
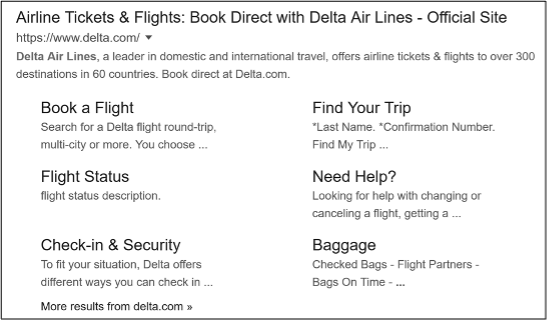
Pictured above, for example, are results from a Google search for “Delta.” Using the search test, one can clearly differentiate the airline from the faucet maker.

Blurring, in other words, is possible in theory but rarely if ever likely in practice because of the disambiguating effect of purchasing context. We initially set out to determine whether placing treatment and control subjects in a purchasing context would affect the comparative speed and accuracy with which they link marks with their sources and associations. What we found led us to recognize that the basic design of previous response time studies was flawed.
1. Pilot Study A: The surprise effect.
We began our response time study by conducting a small-sample pilot to pretest our survey instrument. The objective of this pilot was to measure the speed and accuracy with which subjects identified whether the terms MERCEDES-cars and INFINITI-cars are a match. One hundred subjects were randomly assigned to a mark—either MERCEDES or INFINITI—and then to one of three conditions within each mark. Each mark-condition combination had between fifteen and seventeen respondents. The pilot protocol initially followed the method that we used in Study 1. Subjects in the control condition saw the three filler text-only “tombstone” advertisements for well-known brands (PERRIER sparkling water, CHASE bank, UNITED VAN LINES), while subjects in our two treatment groups saw the three filler ads plus either the ad for MERCEDES Toothpaste or the ad for INFINITI Toothpaste.
After looking at the ads, subjects in one of the treatment groups participated in a brief car buying role-play task—that is, a task related to the targeted brands and intended to contextualize the matching task. These subjects were asked to write about the steps they would take in the process of purchasing a car, to think about how many dealerships they would visit, and to rank various features such as speed, roominess, and affordability. Subjects in the control group and the other treatment group performed a similar task after seeing the ads, but instead of being asked to imagine the process of buying a car, they were asked to imagine the process of searching for a job—a process unrelated to the targeted marks. In addition to allowing us the opportunity to expose some subjects to a purchasing context, these exercises served as distractors between the ads and the response time portion of the study.73 And if relevant context assists consumers in disambiguating the marks, we should see less, or no, response time delays for our subjects who were exposed to the car buying context (relevant to the targeted marks) versus subjects exposed to the job search context (irrelevant to the targeted marks).
In the response time portion of the protocol, which came next, all subjects were informed that they would see a brand name and a word on the following screens. Subjects were told to click a “Yes” button if the mark and the word matched and to click a “No” button if they did not. Subjects were asked to click as quickly as possible without sacrificing accuracy.
Subjects were then shown thirty brand-mark pairs. Twenty-five of these were “filler” pairs for marks such as MCDONALD’S, CHASE, COCA COLA, PERRIER, MICROSOFT, and UNITED. Mixed in with the filler pairs were pairs for one of our target marks, either MERCEDES or INFINITI. These pairs included the product category “cars” and two product attributes strongly associated with each mark in the Brand Selection Pretest (that is, “wealth” and “luxury” in the case of Mercedes; “fast” and “luxury” in the case of Infiniti). As in our association studies (Studies 1 and 2, described above), we also included a product attribute that is not strongly associated with either mark (“cheap”) and a product category that is unrelated to cars (“printers”). Subjects in the MERCEDES group therefore saw MERCEDES-cars, MERCEDES-wealth, MERCEDES-luxury, MERCEDES-printers, and MERCEDES-cheap mixed in with the twenty-five filler pairs. Subjects in the INFINITI group saw INFINITI-cars, INFINITI-fast, INFINITI-luxury, INFINITI-printers, and INFINITI-cheap mixed in with the twenty-five filler pairs. Through Qualtrics, we were able to measure the time it took each subject to click “Yes” or “No,” down to one one-thousandth of a second.74
When we compared average response times, our results for the MERCEDES group matched what others have found before: subjects who saw a diluting MERCEDES Toothpaste ad were slightly slower (by about two-tenths of a second) than control subjects to respond when the pair MERCEDES-cars flashed onto the screen. That delay was statistically significant (difference = 0.194 seconds; p < 0.05). Subjects who saw the MERCEDES Toothpaste ad were also slower to respond when the pairs MERCEDES-printers (difference = 0.183; p < 0.05) and MERCEDES-wealth (difference = 0.345; p < 0.05) appeared on screen. We saw no such differences for the INFINITI pairs.
But we also noticed something that we did not expect. In addition to a statistically significant difference in average response time between treatment and control groups on the MERCEDES-cars, MERCEDES-printers, and MERCEDES-wealth pairs, we noticed statistically significant differences between control and treatment groups on many of the filler pairs. Subjects in the MERCEDES treatment groups, for example, were slightly slower to click “Yes” or “No” when pairs like MCDONALD’S-hamburgers (difference = 0.378; p < 0.01), MCDONALD’S-affordable (difference = 0.203; p < 0.05), MCDONALD’S-healthy (difference = 0.251; p < 0.05), MICROSOFT-software (difference = 0.234; p < 0.05), COCA COLA-expensive (difference = 0.211; p < 0.05), and UNITED-boxes (difference = 0.416; p < 0.05) appeared on screen.
The fact that our MERCEDES Toothpaste ad led to slower response times, not only for the MERCEDES-cars pair but for a total of sixteen mark-word pairs completely unrelated to the MERCEDES mark, gave us pause and caused us to question what these response time experiments are actually measuring. Were we measuring dilution of the MERCEDES and INFINITI marks? Or was the diluting ad so unexpected by subjects that it distracted or surprised them and either caused them to suspect that experimenters were trying to trick them or simply diverted their attention from the task at hand? The latter would merely be an experimental artifact that could not be construed as harming the mark. We designed a second pilot to examine these issues.
2. Pilot Study B: Controlling for potential surprise.
Our first pilot led us to hypothesize that an unexpected or surprising stimulus could give subjects pause as they proceed through the experimental task, resulting in slower response times in general, even for marks included in the task that the stimulus did not target. If this were the case, differences in response times between treatment and control groups would not be a sign of dilution but rather an artifact of an experimental design that fails to properly control for the potentially distracting effects of any unexpected stimulus. Studies reported in the psychology and consumer studies literature support this understanding.75 Accordingly, we designed a second pilot to isolate this potential source of methodological error.
Pilot B was virtually identical in structure to Pilot A except that the protocol attempted to control for any unexpected stimulus. Again, we administered the study to one hundred subjects. The treatment groups were the same as in Pilot A. The sample sizes for the mark-treatment combinations ranged between fifteen and eighteen per group. Now, however, our control group subjects would see an ad for a fictitious NIKE Toothpaste in addition to the three filler ads. Our logic was that if our MERCEDES/INFINITI Toothpaste ads were causing subjects to slow down on the matching exercise simply because they were unexpected, that effect could be offset by including an ad that was just as unexpected in the control group; that is, we would add a control ad to the control group. Statistically significant differences between treatment groups and the control group, in other words, should diminish or vanish if a surprise-type effect is at work.
When we compared average response times for the treatment and control groups, we found that this is exactly what happened. Virtually no statistically significant differences in response times for the MERCEDES pairs, the INFINITI pairs, or the filler pairs appeared in Pilot B. Across all groups and marks, there were twenty-nine statistically significant delays in Pilot A and only four statistically significant delays in Pilot B. There were six significant delays on the MERCEDES matches in Pilot A, none in Pilot B, and none for INFINITI in either study. Also, comparison across treatments revealed no effect of context.
The results of our first two pilots led us to question the validity of using the traditional response time experiments to measure dilution. Whereas before we assumed that response time experiments were a valid way to measure dilution, we now believe that statistically significant results in the prior Morrin and Jacoby and Pullig, Simmons, and Netemeyer experiments could have been due to failure to control for the surprise effect caused by the supposedly diluting ad. It could be that the mere presence of any unexpected mark-category combination in an ad slows down processing because the consumer is busy wondering what was behind the surprising stimulus. But because the small subject pool for our pilot response time studies increased the risk of spurious results, we decided to run our redesigned control condition with a large sample to confirm our suspicions. Accordingly, we designed a larger-scale experiment to more formally test the extent to which response time experiments measure dilution versus the effect of the unexpected. Because we found no indication that our context manipulation had any effect in either of our two pilots, we focused exclusively on the element of the unexpected.
C. Study 3: Response Time and Category Recall When Controlling for Surprise
We proceeded with a larger-scale study (N = 1,343) to disentangle the two possible causes for the observed reaction times in our two pilot studies. We randomly assigned subjects to a MERCEDES group or an INFINITI group. For each targeted mark, subjects were randomly assigned to one of three groups: a treatment group or one of two control groups. Subjects in the treatment group saw the three filler ads plus a MERCEDES- or INFINITI-diluting ad (N = 444). Subjects in the first control group saw only the three filler ads (N = 451), and subjects in the second control group saw the three filler ads plus a NIKE Toothpaste ad (N = 448). After viewing the ads, subjects participated in the job search role-play task as a distractor. They then answered the same thirty matching questions we presented in the first two studies.
1. Response times.
Our results indicate that once we control for the effect of any surprising mark-category combination, evidence of blurring disappears. In other words, with respect to the average response times in which subjects link MERCEDES and INFINITI with their traditional associations, there are no significant differences between subjects exposed to ostensibly blurring ads involving the targeted marks (MERCEDES Toothpaste and INFINITI Toothpaste) and subjects exposed to ostensibly blurring ads involving a mark other than the targeted marks (NIKE Toothpaste).
Consider first Table 3A. This table reports the average treatment effects (that is, the average response time of the treatment group minus the average response time of the control group) for MERCEDES treatment subjects (who were exposed to the three filler ads and the MERCEDES Toothpaste ad) and control subjects within the first control group (who were exposed to the three filler ads only). In the first row, there is no statistically significant difference between the treatment and control groups on the product-category pair MERCEDES-cars, which indicates that the diluting stimulus was not causing subjects to dissociate the brand MERCEDES from its traditional product category. We do see, however, what could be interpreted as a form of blurring of the association between MERCEDES and “luxury.” On average, subjects who saw the MERCEDES Toothpaste ad took 0.075 seconds longer than subjects in the control group to determine whether MERCEDES and LUXURY match (p < 0.05). Although this difference is statistically significant, it is substantively very small. Furthermore, no other differences for the target MERCEDES brand are statistically significant from zero.
| Treatment Group: Mercedes Toothpaste Ad | ||
|---|---|---|
| Control Group: No Fourth Ad | ||
| Target Brand | ||
| Mercedes-Luxury | 0.075** | (0.041) |
| Mercedes-Printers | 0.023 | (0.053) |
| Mercedes-Cars | −0.046 | (0.105) |
| Mercedes-Cheap | 0.092 | (0.079) |
| Mercedes-Wealth | 0.063 | (0.066) |
| Filler Brands | ||
| Chase-Money | 0.025 | (0.036) |
| Chase-Restaurants | 0.037 | (0.036) |
| Coca Cola-Expensive | −0.005 | (0.059) |
| Coca Cola-Soft Drinks | 0.007 | (0.034) |
| Coca Cola-Sour | 0.098** | (0.059) |
| Coca Cola-Toothpaste | 0.064 | (0.045) |
| McDonald’s-Affordable | −0.008 | (0.041) |
| McDonald’s-Fries | 0.067 | (0.052) |
| McDonald’s-Hamburgers | 0.060 | (0.059) |
| McDonald’s-Healthy | 0.042 | (0.040) |
| McDonald’s-Sunset | 0.020 | (0.064) |
| Microsoft-Bicycles | −0.038 | (0.057) |
| Microsoft-Computers | 0.164** | (0.077) |
| Microsoft-Reliable | −0.012 | (0.098) |
| Microsoft-Software | 0.024 | (0.061) |
| Microsoft-Luxury | −0.021 | (0.058) |
| Perrier-Bottle | −0.121 | (0.105) |
| Perrier-Clothing | −0.071 | (0.067) |
| Perrier-Pure | 0.041 | (0.088) |
| Perrier-Soft | −0.039 | (0.077) |
| Perrier-Water | 0.019 | (0.068) |
| United-Boxes | −0.010 | (0.070) |
| United-Horses | 0.111 | (0.075) |
| United-Small | −0.077 | (0.087) |
| United-Trucks | 0.080 | (0.082) |
| Standard errors in parentheses Two-tailed test: ** p < 0.05, *** p < 0.01 |
||
Table 3A further indicates that the diluting stimulus is associated with slower response times on two unrelated brands. Treatment group participants, for example, were slower by 0.098 seconds to react to the COCA COLA-sour pair and by 0.164 to the MICROSOFT-computer pair. This signals that the MERCEDES Toothpaste ad may have been unexpected by treatment subjects and may have slowed them down generally.
| Treatment Group: Mercedes Toothpaste Ad | ||
|---|---|---|
| Control Group: Nike Toothpaste Ad | ||
| Target Brand | ||
| Mercedes-Luxury | −0.026 | (0.096) |
| Mercedes-Printers | −0.096 | (0.129) |
| Mercedes-Cars | 0.022 | (0.037) |
| Mercedes-Cheap | 0.047 | (0.103) |
| Mercedes-Wealth | 0.083 | (0.065) |
| Filler Brands | ||
| Chase-Money | −0.014 | (0.048) |
| Chase-Restaurants | 0.029 | (0.036) |
| Coca Cola-Expensive | −0.098 | (0.073) |
| Coca Cola-Soft Drinks | −0.066 | (0.040) |
| Coca Cola-Sour | 0.032 | (0.062) |
| Coca Cola-Toothpaste | 0.060 | (0.042) |
| McDonald’s-Affordable | 0.006 | (0.036) |
| McDonald’s-Fries | 0.015 | (0.073) |
| McDonald’s-Hamburgers | 0.117** | (0.050) |
| McDonald’s-Healthy | −0.017 | (0.042) |
| McDonald’s-Sunset | 0.049 | (0.056) |
| Microsoft-Bicycles | −0.079 | (0.091) |
| Microsoft-Computers | 0.104 | (0.079) |
| Microsoft-Reliable | −0.010 | (0.060) |
| Microsoft-Software | 0.036 | (0.050) |
| Microsoft-Luxury | −0.083 | (0.058) |
| Perrier-Bottle | 0.025 | (0.050) |
| Perrier-Clothing | 0.017 | (0.046) |
| Perrier-Pure | 0.120 | (0.077) |
| Perrier-Soft | −0.033 | (0.069) |
| Perrier-Water | 0.091 | (0.065) |
| United-Boxes | 0.023 | (0.062) |
| United-Horses | 0.029 | (0.080) |
| United-Small | −0.012 | (0.066) |
| United-Trucks | 0.021 | (0.089) |
| Standard errors in parentheses Two-tailed test: ** p < 0.05, *** p < 0.01 |
||
Table 3B shows what happens when we control for the appearance of a surprising mark-category combination. It reports the average treatment effects for MERCEDES treatment subjects and control subjects within the second control group (who were exposed to the three filler ads and the Nike Toothpaste ad). The statistically significant differences that we saw in Table 3A disappear, not simply with respect to MERCEDES-luxury but also with respect to COCA-COLA-sour and MICROSOFT-computers. Only one statistically significant response time difference remains (MCDONALD’S-hamburgers), which could be due to chance. In essence, while Table 3A reports very weak evidence of blurring, Table 3B shows that once the proper control is used, even that very faint evidence of blurring disappears.
Tables 4A and 4B, which report results for the same experiments applied to the INFINITI mark, provide further support for the hypothesis that previous response time experiments failed to control for the effect of having any unexpected stimulus. Table 4A reports treatment effects for the INFINITI treatment group as compared to the first control group, and Table 4B reports treatment effects for the INFINITI treatment group as compared to the second control group. Consistent with our MERCEDES results, Table 4B shows that all statistically significant increases in mean response time disappeared when the second control group was also exposed to an ostensibly diluting ad.
| Treatment Group: Infinite Toothpaste Ad | ||
|---|---|---|
| Control Group: No 4th Ad | ||
| Target Brand | ||
| Infiniti-Luxury | 0.029 | (0.080) |
| Infiniti-Printers | −0.078 | (0.078) |
| Infiniti-Cars | 0.125 | (0.096) |
| Infiniti-Fast | 0.108 | (0.110) |
| Infiniti-Cheap | 0.131*** | (0.053) |
| Filler Brands | ||
| Chase-Money | −0.022 | (0.033) |
| Chase-Restaurants | 0.121** | (0.066) |
| Coca Cola-Expensive | 0.043 | (0.045) |
| Coca Cola-Soft Drinks | −0.023 | (0.045) |
| Coca Cola-Sour | 0.024 | (0.035) |
| Coca Cola-Toothpaste | 0.080 | (0.117) |
| McDonald’s-Affordable | −0.038 | (0.043) |
| McDonald’s-Fries | −0.003 | (0.038) |
| McDonald’s-Hamburgers | 0.072** | (0.036) |
| McDonald’s-Healthy | 0.038 | (0.038) |
| McDonald’s-Sunset | 0.120** | (0.053) |
| Microsoft-Bicycles | −0.013 | (0.061) |
| Microsoft-Computers | −0.012 | (0.040) |
| Microsoft-Reliable | −0.099 | (0.084) |
| Microsoft-Software | 0.031 | (0.039) |
| Microsoft-Luxury | 0.065 | (0.056) |
| Perrier-Bottle | 0.039 | (0.061) |
| Perrier-Clothing | 0.231** | (0.137) |
| Perrier-Pure | −0.013 | (0.067) |
| Perrier-Soft | −0.024 | (0.098) |
| Perrier-Water | 0.083*** | (0.035) |
| United-Boxes | 0.226 | (0.161) |
| United-Horses | 0.045 | (0.075) |
| United-Small | −0.073 | (0.073) |
| United-Trucks | 0.043 | (0.061) |
| Standard errors in parentheses Two-tailed test: ** p < 0.05, *** p < 0.01 |
||
| Treatment Group: Infinite Toothpaste Ad | ||
|---|---|---|
| Control Group: No Fourth Ad | ||
| Target Brand | ||
| Infiniti-Luxury | 0.021 | (0.054) |
| Infiniti-Printers | −0.014 | (0.055) |
| Infiniti-Cars | −0.043 | (0.141) |
| Infiniti-Fast | 0.079 | (0.101) |
| Infiniti-Cheap | −0.043 | (0.107) |
| Filler Brands | ||
| Chase-Money | −0.046 | (0.033) |
| Chase-Restaurants | 0.034 | (0.081) |
| Coca Cola-Expensive | −0.068 | (0.047) |
| Coca Cola-Soft Drinks | −0.071 | (0.051) |
| Coca Cola-Sour | −0.045 | (0.038) |
| Coca Cola-Toothpaste | 0.023 | (0.107) |
| McDonald’s-Affordable | −0.080 | (0.044) |
| McDonald’s-Fries | −0.020 | (0.036) |
| McDonald’s-Hamburgers | 0.037 | (0.037) |
| McDonald’s-Healthy | −0.045 | (0.043) |
| McDonald’s-Sunset | −0.045 | (0.066) |
| Microsoft-Bicycles | −0.158 | (0.119) |
| Microsoft-Computers | −0.047 | (0.036) |
| Microsoft-Reliable | −0.063 | (0.052) |
| Microsoft-Software | −0.060 | (0.044) |
| Microsoft-Luxury | −0.032 | (0.064) |
| Perrier-Bottle | 0.002 | (0.063) |
| Perrier-Clothing | 0.216 | (0.137) |
| Perrier-Pure | −0.100 | (0.076) |
| Perrier-Soft | −0.094 | (0.089) |
| Perrier-Water | −0.018 | (0.041) |
| United-Boxes | 0.081 | (0.172) |
| United-Horses | −0.034 | (0.076) |
| United-Small | −0.110 | (0.082) |
| United-Trucks | −0.201 | (0.121) |
| Standard errors in parentheses Two-tailed test: ** p < 0.05, *** p < 0.01 |
||
On the basis of this and our two pilot studies, we conclude that previous response time studies used an insufficient control. Thus, they cannot serve as models for surveys used in litigation or as evidence that ostensibly diluting conduct actually causes any appreciable blurring of consumers’ ability to link marks with their traditional sources and associations. These previous studies used the equivalent of our first control group when they should have used the equivalent of our second control group. If future response time studies set out to detect dilution, whether in a litigation or academic context, they must expose control subjects to stimuli that, while not targeting the marks being tested for dilution, are at least as surprising or unexpected to control subjects as the ostensibly diluting stimuli to which treatment subjects are exposed.
2. Category recall.
In addition to response time, Morrin and Jacoby examined the accuracy of category-association matching as an indicator of trademark blurring.76 We did the same. We explored whether the MERCEDES Toothpaste and INFINITI Toothpaste ads had any impact on subjects’ ability to recall the traditional product categories of the MERCEDES or INFINITI marks. If the MERCEDES Toothpaste or INFINITI Toothpaste ads are causing blurring, we would expect fewer subjects in the treatment groups to identify MERCEDES-cars or INFINITI-cars as a match compared to subjects in the control groups.
| Panel A. | |||
|---|---|---|---|
| Treatment Group: Mercedes/Infiniti Toothpaste Ad | |||
| Control Group: No Fourth Ad | |||
| Mercedes-Cars | Infiniti-Cars | ||
| −0.006 | −0.043 | ||
| (0.015) | (0.027) | ||
| Panel B. | |||
| Treatment Group: Mercedes/Infiniti Toothpaste Ad | |||
| Control Group: Nike Ad | |||
| Mercedes-Cars | Infiniti-Cars | ||
| −0.023** | −0.016 | ||
| (0.012) | (0.028) | ||
| Standard errors in parentheses Two-tailed test: ** p < 0.05, *** p < 0.01 |
|||
Table 5 shows average treatment effects for the category recall tests in terms of the difference in percentages of correct classifications between the treatment groups and the first and second control groups. The negative signs on the coefficients indicate that treatment group subjects were less likely to state that MERCEDES-cars or INFINITI-cars is a match. These differences, however, were generally quite small and statistically significant in just one of four cases. Panel A shows comparisons between treatment subjects and subjects in the first control group, who were exposed to the three filler ads only. The difference between treatment and control subjects on the MERCEDES-cars exercise was tiny and not statistically different from zero. In fact, 97.8 percent of subjects in the control group said these words were a match compared to 97.2 percent of subjects in the treatment group for a difference of 0.6 percent. The difference between treatment and control subjects on the INFINITI-cars exercise is slightly larger. Control group subjects identified these words as a match in 93.3 percent of cases compared to treatment subjects, who identified the words as a match in 89.0 percent of cases. This difference, however, is not statistically significant. Turning to the MERCEDES-cars column in Panel B, we now find that there is a statistically significant difference between treatment and control groups when the control group sees a NIKE Toothpaste ad. Control group subjects said these words were a match in 99.5 percent of cases compared to 97.2 percent of cases in the treatment group. We do not, however, observe a statistically significant difference in the INFINITI-cars column when the second control group saw a NIKE Toothpaste Ad. Control group subjects said INFINITI-cars is a match in 90.6 percent of cases compared to 89.0 percent of cases among treatment group subjects.
Taken together, the results presented in Table 5 show that subjects who saw a MERCEDES Toothpaste or INFINITI Toothpaste ad were always less accurate, on average, in tests that asked them to recall the primary product category of the MERCEDES or INFINITI marks. At the very least, this test indicates that seeing an ad for a familiar brand name in an unexpected product category can cause a small number of people to dissociate a brand name from its primary product category. This test cannot tell us, however, whether what we are observing is dilution or that a small number of subjects became confused or distracted after seeing the toothpaste ads—that is, they thought that the association we had actually presented to them (MERCEDES-toothpaste; INFINITI-toothpaste) was the product category association we were asking about. Recall that, in Study 1, we found only very weak evidence that exposure to an ostensibly diluting stimulus lessened the strength of the association between the mark and its product category or relevant product attributes.77 If the small reductions in product category recall we found for subjects in some, but not all, treatment branches in Study 3 were indeed related to product category dissociation caused by blurring, rather than by subject confusion, we would expect to see a clearer reduction of the strength of associations in Study 1.
III. Does Trademark Blurring Ever Occur?
The research reported here confirms what the Supreme Court’s Moseley dictum suggests—that evidence that consumers associate a junior mark with a famous senior mark does not, as a matter of necessity, indicate that the senior mark is likely to suffer dilution via the blurring of its own associations with its source or other attributes.78 As a consequence, courts that have accepted evidence of association as sufficient to establish a likelihood of dilution have erred. Our research also describes an association strength test for proving dilution and offers a path—set out in our discussion of Studies 1 and 2 in Part I.C—that courts can require plaintiffs pressing dilution claims to follow. Finally, our research casts substantial doubt on the validity of what previously had stood as the best evidence we have that the blurring form of trademark dilution actually exists. The response time studies that have been reported as (and assumed to be) evidence of blurring appear instead to be the result of treatment subjects’ surprise at seeing ads associating famous marks with products very different from those normally sold under such marks. We applied a redesigned control condition that accounts for the surprise created by this unexpected stimulus, and the response delays that we were previously able to reproduce disappeared almost entirely.
Our experiments provide methodologically valid and judicially administrable techniques for assessing the likelihood of blurring. Litigants can design studies to mimic our Studies 1 and 2 or the revised version of the response time protocol that we present in Study 3. We prefer the methodologies of Studies 1 and 2. They are easier to undertake and less subject to experimenter error, we believe, than the relatively complex response time study we present in Study 3. But we must confess that, though we have made a contribution by offering methods that both are administrable and possess construct validity, in a deeper sense we remain at sea. Our experiments do not settle the question of the existence of trademark blurring. It is of course possible that future surveys used in litigation or academic empirical studies may be able to reliably detect “association” between two similar marks that “impairs the distinctiveness” of one of them. But at present, we have only very weak evidence that this form of dilution ever actually occurs. We have little more than “just so” stories, such as ours of a hypothetical Apple bar, that attempt to explain how dilution by blurring might operate.
So where does that leave us? In this Part, we first consider an alternative interpretation of our findings in Study 3, one which we believe to be unconvincing. We then suggest that the theory of dilution by blurring remains such an unproven mess because, in practice, dilution is really about misappropriation.
A. Superdilution?
There may be hope for the actuality of blurring in one interpretation of our results in Study 3. This interpretation might hold that exposing consumers to surprising stimuli in the form of incongruous combinations of marks and new associations causes what might be termed “superdilution,” in which such surprising stimuli impair consumers’ ability to link marks with their traditional sources and associations for all marks throughout the marketplace.79 Thus, when Brooklynites see Apple bar, their ability to navigate the marketplace as a whole marginally declines because they are reminded that the same mark may be used by more than one company.
We find this interpretation of our results unpersuasive. We believe that the increased response times we detected prior to the application of our redesigned control condition are an artifact of our experiment and not likely to translate to actual consumer perception in the marketplace. Subjects in our experiment are presented with a number of prompts, and they don’t know which prompts are salient. Therefore, as subjects proceed through the experiment, they are likely to treat every prompt as possibly salient. Subjects do not know what the experiment is about. So they keep at the front of their minds all potentially relevant information. And therefore, the surprising stimulus affects behavior in our experiment. On the other hand, consumers in the marketplace rely on myriad contextual cues, as well as their own sense of their current aims, to decide what portion of the swarm of information coming at them every second to regard, and what portion to disregard.80 As a consequence, consumers may only rarely, if ever, treat an unexpected stimulus in the marketplace as salient. Consumers take the surprising information in as part of the welter of information, and unless the environment is set up at that moment to make it salient, they may never apply it to their mark-product or mark-attribute identification efforts. So if one sees a MERCEDES Toothpaste ad out in the marketplace, one might experience a moment of surprise, but for the stimulus to have an effect on behavior, it would have to be salient to a particular task in which the observer is engaged or will soon become engaged. Otherwise, it seems unlikely that the surprise would affect behavior.
B. Dilution and Misappropriation
Given the absence of proof that dilution by blurring actually occurs, we are left to speculate that the problem may ultimately be not with our experiments or the surveys or experiments of others but with the concept of blurring itself. The notion of dilution originally emerged out of the 1924 German Odol case,81 which was essentially a case about misappropriation, one which happened to involve a trademark.82 But when Professor Frank Schechter introduced the concept of dilution to American law in his still widely cited 1927 article, The Rational Basis of Trademark Protection,83 he downplayed the fact that dilution was a misappropriation doctrine and went so far as to expurgate from his translation of the Odol opinion the court’s core finding that the respondent had “appropriate[d] thus the fruit of another’s labor.”84 Heavily influenced by law and economics thinking on trademark law, with its focus on consumer search costs, the American concept of dilution evolved into the concept of “blurring” and the idea that, when two firms use the same mark, consumers must “think for a moment,” which increases their search costs.85 We have struggled ever since to develop empirical proof that any appreciable increase in search costs actually occurs.
Yet courts continue to rule in favor of plaintiffs on antidilution causes of action. We suggest, as others have,86 that they do so primarily for reasons sounding in misappropriation, but never articulated as such. The concept of “blurring” acts as an alibi for courts that want to reach what they deem to be the right result in cases like Nikepal, in which a defendant uses another’s famous mark on unrelated goods. The defendant is not causing consumer confusion, but it is reaping where it has not sown by appropriating some of the notoriety of the famous mark. Courts are motivated to accept mere association survey evidence as full-blown evidence of impairment to justify enjoining conduct they deem to be unfair misappropriation.87
This is problematic for at least two reasons. First, we continue to twist ourselves into contortions to develop evidence of blurring, of some weakening of associations or increase in response times and search costs, when courts’ underlying focus is on fairness and misappropriation. The result is that the concept of dilution grows increasingly vague and outcomes grow increasingly unpredictable. Second, unlike its European counterpart,88 the American antidilution statute contains no misappropriation provision. Congress has twice had the opportunity to include such a provision, and twice it has declined to do so.89 To the extent that courts are ruling on unstated misappropriation grounds, they are acting outside of the federal statutory framework.
Conclusion: Future Directions for Research
The cause of action for trademark dilution by blurring has been authorized by federal law since 1996 and by the laws of various states for decades prior to that.90 And yet the concept that the law identifies and prohibits may not even exist out in the world. Lawyers continue to litigate claims of dilution by blurring, but courts lack the most basic tool necessary for the disciplined adjudication of these claims: a reliable measure of the likelihood of dilution.
The mere association test is entirely unsuitable as a test for dilution by blurring. At the level of logic, evidence of the association between an ostensibly diluting use of a mark and the senior mark owner is not tantamount to evidence that the senior mark has become less associated with the senior mark owner, as is necessary for the senior mark’s distinctiveness to be impaired. And as our Studies 1 through 3 demonstrate, an ostensibly diluting use may lead to association with a new category without causing the required disassociation from the existing one.
Our association strength test, and the tests we offer in Studies 1 and 2, are a more promising measure of the likelihood of dilution, but they must be undertaken carefully, and courts must be cautious in assessing the strength of evidence they produce. Similarly, response time tests may be a valid measure of the likelihood of dilution, but again, they must be constructed carefully. We have attempted to do so here. In particular, we found that previous response time studies failed to control for the surprising effect of the unexpected ostensibly diluting stimulus. Once we controlled for that surprise-type effect, thereby isolating in our experimental treatment the potential effect of dilution by blurring, we found that the evidence we’d previously found for blurring almost entirely disappeared. We also caution that, relative to our association strength tests, response time studies are difficult to administer and subject to experimenter error.
This leaves us both better off and worse off than before. We believe that we have produced, at last, methodologically sound tests for measuring the likelihood of dilution. As applied to our test brands, however, none of the measures provided strong evidence that dilution actually occurs. This is not to deny the possibility that the measure might yield evidence of dilution if applied to other target brands with other ostensibly diluting stimuli or if respondents were repeatedly exposed to the stimuli longitudinally over time.91 That is possible. But even if we applied it to other brands and measured significant reductions in association strength or response delays indicating the possibility of dilution, additional questions would arise. We would need to test the possible mitigating effect of market context. And most importantly, we would still need to test whether laboratory protocols to measure dilution by blurring that showed small average association-strength treatment effects, small shifts in the distribution of Likert assessments of association strength, or small time delays in the nature of milliseconds were likely to translate into real-world attribute association, preference, or purchase implications.
In the end, these are questions that remain open. But we have an intuition about where the evidence will lead. We suspect that the concept of dilution by blurring is a chimera—that is, an imaginary thing that we insist upon only because it is valuable to us as a proxy for attacking unauthorized uses of senior marks that our intuition tells us are unfair. It is true that, in at least some dilution cases, defendants are engaged in some form of free riding on the fame and goodwill enjoyed by the plaintiff’s mark. Free riding is, admittedly, not a simple thing to judge. Whether it is fair or unfair, productive or destructive, often depends on subtle differences in context. But courts are better at judging these sorts of contextual questions than they are at running a social science inquiry into the hypothesized, but unproven, cognitive concept of “blurring.” It is better, we think, to reframe the dilution cause of action away from cognitive science and toward the broader and more tractable questions of fairness and harm that the courts have become accustomed to dealing with in misappropriation cases.
Appendix A: Amazon Mechanical Turk
We recruited subjects for our studies via Amazon’s Mechanical Turk. Once a subject selected the task we listed on Mechanical Turk, he or she was directed to the Qualtrics online social science research platform to complete a survey instrument. Our instrument reflected the procedures used by Professors Morrin and Jacoby and by Professors Pullig, Simmons, and Netemeyer.92
Online crowdsourcing services like Amazon Mechanical Turk offer researchers the advantage of being able to run experimental protocols on large samples at a fraction of the cost of lab studies. They also allow researchers to pilot various instruments so that hypotheses and empirical tools can be tested, refined, and retested. Online response time experiments are possible because JavaScript timers can record clicks down to the millisecond. There are, however, some potential disadvantages to conducting a response time experiment online that we investigated and addressed. Namely, subjects in an online experiment use their own hardware and software in contrast to a laboratory setting, in which subjects use the same hardware and software. While there are surely differences in the connection speeds, browser speeds, processor speeds, and keyboard and mouse clicking speeds of subjects recruited through Amazon Mechanical Turk, we assume that these differences are small and randomly distributed across subjects. Professor Matthew Crump, John McDonnell, and Professor Todd Gureckis confirm this assumption in a widely cited study that used subjects recruited through Mechanical Turk to replicate outcomes in four types of common laboratory reaction time studies.93
To test whether differences caused by hardware, software, and network speed are actually randomly distributed, we collected click-speed data from 980 Mechanical Turk respondents using the timer function in Qualtrics. All respondents were required to use a desktop or laptop computer with mouse and asked to perform the same exact tasks. First, they were told to click the “next” button eleven times. Second, they were told to click a single option on the screen, then click the “next” button. They did this ten times. Third, they were asked five easy multiple-choice questions and then told to click the “next” button (for example, “Which company sells hamburgers? Microsoft, Google, McDonald’s, or Facebook”). Qualtrics measured click speeds for each of the twenty-six tests to the thousandth of a second.
We then randomly assigned respondents to two groups and compared mean click speeds. If the effects of hardware, software, and network speeds are not randomly distributed, we should observe statistically significant differences in the group means. If these effects are randomly distributed, on the other hand, the differences between the group means should not be statistically different from zero due to the fact that the groups were created arbitrarily. Of course, we expected to observe some differences between the group means due to chance, but such differences should not be observed more than 5 percent of the time on average (at p < 0.05) if the effects of hardware, software, and network speeds are randomly distributed.
We began by drawing 900 subjects (out of the 980 people surveyed) at random and randomly assigning them to two groups. We then compared the means of the two groups for each of the twenty-six questions. We observed statistically significant differences between the groups on two of the twenty-six questions. We then drew another random sample of nine hundred subjects and randomly assigned them to two groups. This time we observed a statistically significant difference between groups on one of the twenty-six questions. We repeated the procedure and again observed two statistically significant differences. On the fourth trial, we observed no statistically significant differences. We repeated this procedure a total of seventy times using various sample sizes: n = 100, n = 500, n = 700, n = 900, and n = 980. In sum, we compared 1,820 pairs (that is, 26 questions multiplied by 70 random draws). Overall, we observed statistically significant differences in 87 of the 1,820 comparisons—that is, slightly less than 5 percent of the time. The number of statistically significant differences did not seem to depend systematically on sample size.94 All together, these comparisons corroborate prior studies that argue that the effects of hardware, software, and network speeds in online response time tests are randomly distributed across subjects and thus do not systematically bias results.
Another potential disadvantage is that subjects recruited online cannot be monitored to ensure that they are following instructions or remaining attentive to the experiment. One instruction we feared might be broken was that subjects use a laptop or desktop computer with a mouse or touchpad, not a touchscreen device like a tablet or smartphone. To ensure that we were measuring reaction times of only people using a mouse or touchpad, we applied a setting in Qualtrics that prohibited people with touchscreen mobile operating systems from participating in the experiment. To make sure subjects were paying attention to the experiment, we examined the data closely for invalid responses. We coded nine response times as missing values because they were greater than fifty seconds, which we believe signaled disengagement during the matching task. These excessively large response times constituted less than 0.02 percent of all response time values in our data set.95 Ninety-nine percent of response times in our data set were three seconds or less, which we believe indicates that the vast majority of subjects were focused and engaged.
Appendix B: Advertisements Used in Studies 1, 2, and 3


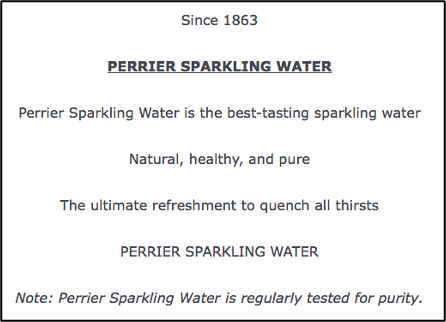
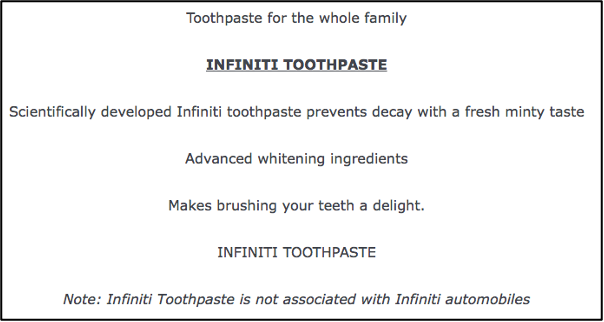
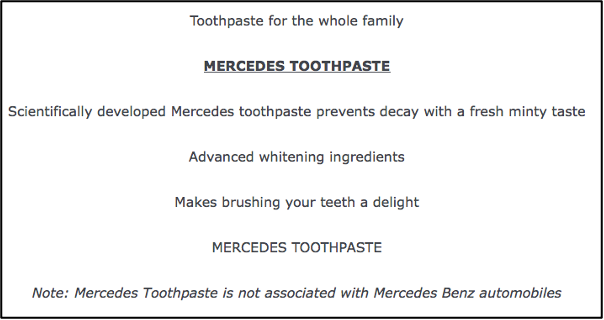
- 1See J. Thomas McCarthy, Dilution of a Trademark: European and United States Law Compared, 94 Trademark Rptr 1163, 1163 (2004) (“No part of trademark law that I have encountered in my forty years of teaching and practicing IP law has created so much doctrinal puzzlement and judicial incomprehension as the concept of ‘dilution’ as a form of intrusion on a trademark.”).
- 2Richard A. Posner, When Is Parody Fair Use?, 21 J Legal Stud 67, 75 (1992) (explaining antidilution law on the basis that “[a] trademark seeks to economize on information costs by providing a compact, memorable, and unambiguous identifier of a product or service. The economy is less when, because the trademark has other associations, a person seeing it must think for a moment before recognizing it as the mark of the product or service”). On the bench, Judge Richard Posner reasoned similarly in explaining the rationale for protection specifically against dilution by blurring:
[T]here is concern that consumer search costs will rise if a trademark becomes associated with a variety of unrelated products. Suppose an upscale restaurant calls itself “Tiffany.” There is little danger that the consuming public will think it’s dealing with a branch of the Tiffany jewelry store if it patronizes this restaurant. But when consumers next see the name “Tiffany” they may think about both the restaurant and the jewelry store, and if so the efficacy of the name as an identifier of the store will be diminished. Consumers will have to think harder—incur as it were a higher imagination cost—to recognize the name as the name of the store. . . . So “blurring” is one form of dilution.
Ty Inc v Perryman, 306 F3d 509, 511 (7th Cir 2002).
- 3See, for example, Christine Haight Farley, Why We Are Confused about the Trademark Dilution Law, 16 Fordham Intell Prop Media & Enter L J 1175, 1187 (2006) (“Can no smart attorney, judge, trademark owner or social scientist figure out what dilution is and how to prove it? If not, why not? I contend that it is because dilution cannot be concretized. It cannot be brought into the realm of the real. It exists only in the realm of the imaginary.”). See also David S. Welkowitz, Reexamining Trademark Dilution, 44 Vand L Rev 531, 548–49, 557–58 (1991) (arguing that antidilution protection is inordinately broad and that other areas of trademark law already provide sufficient protection for trademark rights).
- 4See Board of Regents, the University of Texas System v KST Electric, Ltd, 550 F Supp 2d 657, 674 (WD Tex 2008) (“Dilution causes of action, much more so than infringement and unfair competition laws, tread very close to granting ‘rights in gross’ in a trademark.”).
- 5See Farley, 16 Fordham Intell Prop Media & Enter L J at 1184–85 (cited in note 3).
- 6See Shari Seidman Diamond, Surveys in Dilution Cases II, in Shari Seidman Diamond and Jerre B. Swann, eds, Trademark and Deceptive Advertising Surveys: Law, Science, and Design 155, 161–62 (American Bar Association 2012):
[W]e do not have survey methods that can measure when a particular association is likely to lead to impaired distinctiveness of a particular mark. . . . The result is that courts both now and in the foreseeable future will have to continue to struggle, unaided by direct survey evidence, in making predictions about the ultimate question: likelihood of dilution.
See also J. Thomas McCarthy, 4 McCarthy on Trademarks and Unfair Competition § 24:121 at 437 (Thomson Reuters 5th ed 2018) (explaining the difficulties inherent in determining whether a junior mark is likely to dilute a senior mark).
- 7Compare Louis Vuitton Malletier, S.A. v Hyundai Motor America, 2012 WL 1022247, *11, 13 (SDNY) (finding proof of association conclusive evidence of dilution), with Louis Vuitton Malletier, S.A. v My Other Bag, Inc, 156 F Supp 3d 425, 436 n 4 (SDNY 2016) (rejecting the reasoning in Hyundai because “association is a necessary, but not sufficient, condition for a finding of dilution by blurring”), affd, 674 Fed Appx 16 (2d Cir 2016).
- 815 USC § 1125(c)(2)(B). An alternative form of dilution, which we do not discuss in this Article, is “dilution by tarnishment.” Federal trademark law defines “dilution by tarnishment” as “association arising from the similarity between a mark or trade name and a famous mark that harms the reputation of the famous mark.” 15 USC § 1125(c)(2)(C). Tarnishment “generally arises when the plaintiff’s trademark is linked to products of shoddy quality, or is portrayed in an unwholesome or unsavory context likely to evoke unflattering thoughts about the owner’s product.” Tiffany (NJ) Inc v eBay Inc, 600 F3d 93, 111 (2d Cir 2010), quoting Deere & Co v MTD Products, Inc, 41 F3d 39, 43 (2d Cir 1994).
- 9See, for example, Wrenn v Boy Scouts of America, 2008 WL 4792683, *7 (ND Cal); Hershey Co v Art Van Furniture, Inc, 2008 WL 4724756, *14–15 (ED Mich); New York Yankees Partnership v IET Products and Services, Inc, 114 USPQ2d 1497, 1506 (TTAB 2015).
- 10See, for example, Visa International Service Association v JSL Corp, 610 F3d 1088, 1090–91 (9th Cir 2010) (affirming summary judgment for likely dilution of Visa’s trademark through a mere association standard). See also McCarthy, 4 McCarthy on Trademarks § 24:120 at 432–33 (cited in note 6) (criticizing the Visa court’s reasoning).
- 11See, for example, Hugunin v Land O’ Lakes Tackle Co, 815 F3d 1064, 1067–68 (7th Cir 2016) (dismissing dilution claim for absence of harm showing); Gap Inc v G.A.P. Adventures Inc, 100 USPQ2d 1417, 1431 (SDNY 2011) (holding that likelihood of association absent proof of impairment did not make out dilution claim).
- 12537 US 418 (2003).
- 13Id at 434 (addressing a prior antidilution statute).
- 14Compare Maureen Morrin and Jacob Jacoby, Trademark Dilution: Empirical Measures for an Elusive Concept, 19 J Pub Pol & Mktg 265, 274 (2000) (arguing based on experimental evidence that “trademark dilution can reduce the strength of preexisting brand associations through the creation of additional nodes in consumers’ brand-based memory networks”); Chris Pullig, Carolyn J. Simmons, and Richard G. Netemeyer, Brand Dilution: When Do New Brands Hurt Existing Brands?, 70 J Mktg 52, 60 (2006) (arguing based on experimental evidence that dilution impacts the accessibility of a senior mark’s associations), with Farley, 16 Fordham Intell Prop Media & Enter L J at 1184–85 (cited in note 3) (positing that dilution by blurring rarely, if ever, occurs).
- 15See Trademark Dilution Revision Act of 2006, Pub L No 109-312, 120 Stat 1730, codified in various sections of Title 15; Brian A. Jacobs, Trademark Dilution on the Constitutional Edge, 104 Colum L Rev 161, 168–71 (2004) (discussing the interpretive uncertainties of the repealed Federal Trademark Dilution Act of 1995).
- 16See McCarthy, 4 McCarthy on Trademarks § 24:77 at 244–45 (cited in note 6).
- 1784 USPQ2d 1820, 1824–25 (ED Cal 2007).
- 18Id at 1822.
- 19Id at 1824.
- 20Id at 1825, 1828.
- 21See, for example, Perfumebay.com Inc v eBay Inc, 506 F3d 1165, 1172 (9th Cir 2007) (discussing a similar telephone survey asking respondents what website or company they would think of if they encountered the term “bay” used by a web site). See also Krista F. Holt and Scot A. Duvall, Chasing Moseley’s Ghost: Dilution Surveys under the Trademark Dilution Revision Act, 98 Trademark Rptr 1311, 1324–29 (2008) (reviewing survey evidence of dilution considered by the federal courts in Nikepal and Perfumebay.com). But see Starbucks Corp v Wolfe’s Borough Coffee, Inc, 736 F3d 198, 210–11 (2d Cir 2013) (finding a 3.1 percent response insufficient to prove actual association).
- 22See, for example, Matthew D. Bunker and Kim Bissell, Lost in the Semiotic Maze: Empirical Approaches to Proof of Blurring in Trademark Dilution Law, 18 Comm L & Pol 375, 384 (2013) (“Aside from the problem of conflating association with dilution, the [Nike] survey certainly provides no evidence of dilutive harm since there is no baseline measurement of the strength of Nike’s brand prior to Nikepal’s entry into the marketplace.”).
- 23See Louis Vuitton Malletier S.A. v Haute Diggity Dog, LLC, 507 F3d 252, 267 (4th Cir 2007) (“[B]y making the famous mark an object of the parody, a successful parody might actually enhance the famous mark’s distinctiveness by making it an icon. The brunt of the joke becomes yet more famous.”).
- 24See, for example, Kevin Lane Keller, Conceptualizing, Measuring, and Managing Customer-Based Brand Equity, 57 J Mktg 1, 8 (1993).
- 25Kevin Lane Keller, Strategic Brand Management: Building, Measuring, and Managing Brand Equity 45–51 (Prentice Hall 2013).
- 26This view follows the associative network theory of memory in psychology. See Allan M. Collins and Elizabeth F. Loftus, A Spreading-Activation Theory of Semantic Processing, 82 Psychological Rev 407, 408–09, 411–15 (1975). That theory models information in (long-term) memory as networks of nodes connected by links. For an example of associative network theory applied in the trademark context, see Jacob Jacoby, The Psychological Foundations of Trademark Law: Secondary Meaning, Genericism, Fame, Confusion and Dilution, 91 Trademark Rptr 1013, 1018–24, 1046–50 (2001). Here, the nodes consist of trademarks and concepts linked to or associated with those marks. These concepts include product categories and attributes possessed. When exposed to a trademark, the network containing that trademark is activated and the activation signal spreads outward to the concepts linked to that node. Blurring presumes that that signal activates the node of the desired association more slowly, if at all. See id at 1046–50.
- 27518 F3d 628 (9th Cir 2008).
- 28Id at 631–32.
- 29Id at 636. See also Holt and Duvall, 98 Trademark Rptr at 1332–35 (cited in note 21) (discussing the Jada Toys surveys in detail).
- 30Jada Toys, 518 F3d at 636. See also J. Thomas McCarthy, 6 McCarthy on Trademarks and Unfair Competition § 32:174 at 468–71 (cited in note 6) (describing the survey design used in Union Carbide Corp v Ever-Ready Inc, 531 F2d 366 (7th Cir 1976)).
- 31Jada Toys, 518 F3d at 636.
- 32Id.
- 33Id.
- 34Starbucks Corp, 736 F3d at 211 n 14.
- 35See, for example, McCarthy, 4 McCarthy on Trademarks § 24:116 at 392 (cited in note 6) (“The statutory [dilution] requirement of ‘association’ is not the same kind of mental link that must occur for classic trademark infringement by a likelihood of confusion.”).
- 36Trademark confusion occurs when consumers are confused about the source of products or services because of similarity between two marks used on those products or services. Trademark dilution does not involve consumer confusion about the source of products or services. Trademark dilution refers to the use of a similar mark on products or services that are sufficiently different from the products or services marketed using the famous mark, such that there is no consumer confusion but the use weakens the ability of a famous trademark to indicate the source of products or services, either by linking the mark to unsavory associations (tarnishing) or by linking it to product category or product attribute associations other than those possessed by the senior mark (blurring). See AutoZone, Inc v Tandy Corp, 373 F3d 786, 805 (6th Cir 2004); McCarthy, 4 McCarthy on Trademarks § 24:69 at 217–18, § 24:70 at 221, § 24:116 at 392 (cited in note 6).
- 37We recruited subjects for our studies on Amazon’s Mechanical Turk platform. We discuss Mechanical Turk in Appendix A.
- 38A tombstone advertisement presents information via “black and white text only, with no use of human or animal images or cartoon characters.” Lawrence O. Gostin, Corporate Speech and the Constitution: The Deregulation of Tobacco Advertising, 92 Am J Pub Health 352, 354 (2002).
- 39The tombstone advertisements used in the experiment are reproduced in Appendix B.
- 40Likert scaling is a unidimensional multipoint scaling method that is commonly used to measure agreement with a proposition or (as in our experiment) the degree of association between two identified things or propositions. Unlike binary “yes or no” measures of agreement, Likert scales, which commonly measure agreement or association along a five-point or seven-point scale, provide more information about the strength of the agreement or association that is being measured. See Donald R. Lehmann, Sunil Gupta, and Joel H. Steckel, Marketing Research 242 (Addison-Wesley 1998).
- 41A chi-square test indicates that there is a statistically significant difference between the distributions of the treatment and control groups on the MERCEDES-wealth pair (x2 = 27.07; p = 0.000). This difference, however, is not indicative of a weakening of the association between the MERCEDES brand and the word “wealth.” Rather, the difference between the two distributions appears to occur in the middle of the distribution in such a way that is not indicative of weakening or impairment.
- 42For reasons we explain more fully in the next Part, the control group was shown a toothpaste ad for a famous brand other than MERCEDES or INFINITI to ensure that control subjects were exposed to some ostensibly diluting advertisement, though one not directed at the targeted brands.
- 4315 USC § 1125(c)(2)(B) (emphasis added).
- 44See generally Collins and Loftus, 82 Psychological Rev 407 (cited in note 26).
- 45Morrin and Jacoby, 19 J Pub Pol & Mktg at 265 (cited in note 14).
- 46Pullig, Simmons, and Netemeyer, 70 J Mtkg at 52 (cited in note 14). For other dilution experiments, see generally Maureen Morrin, Jonathan Lee, and Greg M. Allenby, Determinants of Trademark Dilution, 33 J Consumer Rsrch 248 (2006); Hannelie Kruger and Christo Boshoff, The Influence of Trademark Dilution on Brand Attitude: An Empirical Investigation, 24 Mgmt Dynamics 50 (2015).
- 47Morrin and Jacoby, 19 J Pub Pol & Mktg at 268 (cited in note 14).
- 48Id at 268–70.
- 49Though Morrin and Jacoby focused their study on dilution by blurring, they also tested for dilution by tarnishment. Id at 267–68. A senior trademark is tarnished when a junior mark portrays the senior mark in a negative light—for example, by associating it with illegal activities or sexually suggestive messages. The theory underlying liability for dilution by tarnishment is that, even in the absence of confusion regarding the source of the senior mark owner’s products, the selling power of the senior mark may be harmed by the unsavory association. See McCarthy, 4 McCarthy on Trademarks § 24:70 at 221 (cited in note 6).
- 50A brand extension advertisement is an advertisement suggesting that the targeted brand was extending its reach into a product category different from the one with which it had been traditionally associated by consumers. See Morrin and Jacoby, 19 J Pub Pol & Mktg at 266–67 (cited in note 14).
- 51Id at 275.
- 52Id at 268.
- 53Id.
- 54Morrin and Jacoby, 19 J Pub Pol & Mktg at 269 (cited in note 14).
- 55Id.
- 56Id.
- 57Id.
- 58Morrin and Jacoby, 19 J Pub Pol & Mktg at 269 (cited in note 14). Morrin and Jacoby found statistically significant lower matching accuracy only when they measured the control group against the three brands pooled together. When they measured the control group against the brands individually, the accuracy of the treatment group was still lower, but the difference was not significant. Id.
- 59Id. Morrin and Jacoby’s results on recognition accuracy do not detail the associations that they examine apart from brand category (for example, GODIVA chocolate). See id. As such, it is difficult to know what “accuracy” means. Finally, the numbers presented in their Table 1 (top panel) are inconsistent. Id. Unlike the bottom panel of the table, the mean row is not equal to the mean of the rows. Therefore, we find it difficult to interpret or accept the findings.
- 60Id at 270–74.
- 61Id at 274.
- 6215 USC § 1125(c)(2)(A).
- 63See Pullig, Simmons, and Netemeyer, 70 J Mtkg at 55, 58–60 (cited in note 14).
- 64Id at 55–57 (alterations in original).
- 65Id at 57.
- 66Id.
- 67Pullig, Simmons, and Netemeyer, 70 J Mtkg at 57 (cited in note 14).
- 68Id at 58.
- 69Id.
- 70Id at 58–59.
- 71Pullig, Simmons, and Netemeyer, 70 J Mtkg at 60–61 (cited in note 14).
- 72Rebecca Tushnet, Gone in Sixty Milliseconds: Trademark Law and Cognitive Science, 86 Tex L Rev 507, 529–32 (2008).
- 73Distractor tasks were also used in Morrin and Jacoby’s response time study. Morrin and Jacoby, 19 J Pub Pol & Mktg at 272 (cited in note 14).
- 74For a more detailed description of the procedure, see Appendix A.
- 75While no one in the trademark literature had contemplated a surprise effect for such incongruent ads, this effect is consistent with prior work on response times and matching tasks. The psychology literature is replete with studies of perceptual and cognitive matching tasks. See generally, for example, Robert W. Proctor, A Unified Theory for Matching-Task Phenomena, 88 Psychological Rev 291 (1981). Such tasks generally involve either simultaneous or sequential presentation of stimuli (for example, letters, numbers, words) that subjects judge to be the same or different according to criteria set by the experimenter.
One branch of this extensive literature involves priming. In these studies, a priming stimulus, to which the subject generally does not have to react, is presented prior to another stimulus to which the subject generally does have to react. A neutral prime condition serves as a baseline against which a particular type of prime produces facilitation or inhibition in processing a test stimulus. See Proctor, 88 Psychological Rev at 293 (cited in note 75). The pilot studies reported in this Article as well as in the prior trademark dilution literature reviewed earlier all fall into this category.
Delays in response time are often evident when the prime is unrelated to the subsequent stimulus, a concept termed prime validity. James H. Neeley, Semantic Priming and Retrieval from Lexical Memory: Roles of Inhibitionless Spreading Activation and Limited-Capacity Attention, 106 J Experimental Psychology: Gen 226, 230, 251–52 (1977); David A. Taylor, Time Course of Context Effects, 106 J Experimental Psychology: Gen 404, 421–23 (1977); Michael I. Posner and Charles R.R. Snyder, Facilitation and Inhibition in the Processing of Signals, in P.M.A. Rabbitt and S. Dornic, eds, Attention and Performance V 669, 670–71 (Academic 1975). The general consensus in this literature is that the delay can be attributed to both automatic and attentional components. In other words, some effects occur automatically as a result of processing the prime, and others involve the subject’s conscious expectations. Proctor, 88 Psychological Rev at 294 (cited in note 75); Ira Fischler, Associative Facilitation without Expectancy in a Lexical Decision Task, 3 Experimental Psychology Human Perception and Performance 18, 18 (1977).
- 76Morrin and Jacoby, 19 J Pub Pol & Mktg at 268–69 (cited in note 14).
- 77See Part I.B.2.
- 78Moseley, 537 US at 433–34.
- 79This interpretation was offered by several legal scholars who commented on a prior draft of this Article.
- 80See Tushnet, 86 Tex L Rev at 529–32 (cited in note 72).
- 81See Odol, 25 Juristiche Wochenschrift 502 (1924). See also Barton Beebe, The Suppressed Misappropriation Origins of Trademark Antidilution Law: The Landgericht Elberfeld’s Odol Opinion and Frank Schechter’s “The Rational Basis of Trademark Protection”, in Rochelle Cooper Dreyfus and Jane C. Ginsburg, eds, Intellectual Property at the Edge: The Contested Contours of IP 59, 64–70 (Cambridge 2014).
- 82The Odol court asserted that the damage to the mark was to its “selling power.” See Beebe, The Suppressed Misappropriation Origins of Trademark Antidilution Law at 60 (cited in note 81).
- 83Frank I. Schechter, The Rational Basis of Trademark Protection, 40 Harv L Rev 813, 830–33 (1927).
- 84Beebe, The Suppressed Misappropriation Origins of Trademark Antidilution Law at 72 (cited in note 81).
- 85See Posner, 21 J Legal Stud at 75 (cited in note 2).
- 86See, for example, Apostolos Chronopoulos, Goodwill Appropriation as a Distinct Theory of Trademark Liability: A Study on the Misappropriation Rationale in Trademark and Unfair Competition Law, 22 Tex Intell Prop L J 253, 296–97 (2014); David J. Franklyn, Debunking Dilution Doctrine: Toward a Coherent Theory of the Anti-free-rider Principle in American Trademark Law, 56 Hastings L J 117, 131–33 (2004); Richard A. Posner, Misappropriation: A Dirge, 40 Houston L Rev 621, 623 (2003); David S. Welkowitz, Reexamining Trademark Dilution, 44 Vand L Rev 531, 545–46 (1991).
- 87See Nikepal, 84 USPQ2d at 1828 (finding dilution based on a survey in which over 87 percent of participants responded that the word NIKEPAL brought to mind the NIKE brand).
- 88See Directive 2015/2436 of the European Parliament and of the Council of 16 December 2015 to Approximate the Laws of the Member States Relating to Trade Marks, 2015 OJ L336 1, 9 (Dec 23, 2015) (prohibiting the unauthorized use of a qualifying mark that “without due cause takes unfair advantage of, or is detrimental to, the distinctive character or the repute of the trade mark”).
- 89See Federal Trademark Dilution Act of 1995, 109 Stat 985; Trademark Dilution Revision Act of 2006, 120 Stat 1730 (replacing the Federal Trademark Dilution Act).
- 90On state antidilution law, see McCarthy, 4 McCarthy on Trademarks § 24:77 at 244–45 (cited in note 6). By 2016, about three-quarters of the states had some form of statutory antidilution law. Id at 244.
- 91Though difficult to mount, particularly in the litigation context, a longitudinal study might show that repeated exposure to diluting stimuli would at some point generate evidence of blurring. We know of one cleverly designed small-scale pilot study that exposed thirteen undergraduate students weekly over the course of a month to a diluting stimulus in the form of a box of baked goods bearing the trademark CHEVROLET BAKERY. Results from a computer task showed no statistically significant treatment effect. See Dan Svirsky, Measuring Dilution: Is There an Effective Screening Device for Early Detection of Trademark Infections? *31–32 (working paper, 2012) (on file with authors). By contrast, our goal in this Article has been to examine and rectify existing studies designed to detect dilution by blurring, all of which involve single-exposure protocols.
- 92See Morrin and Jacoby, 19 J Pub Pol & Mktg at 268–69 (cited in note 14); Pullig, Simmons, and Netemeyer, 70 J Mtkg at 55–57 (cited in note 14).
- 93Matthew J.C. Crump, John V. McDonnell, and Todd M. Gureckis, Evaluating Amazon’s Mechanical Turk as a Tool for Experimental Behavioral Research, 8 PLOS ONE 1, 3–11 (2013).
- 94For example, we observed statistically significant differences in 3.46 percent of the comparisons when the sample size was 100. This number rose to 6.15 percent when the sample size was 500, decreased to 3.46 percent when the sample size was 700, increased to 5.77 percent when the sample size was 900, then decreased to 5.38 percent when the sample size was 980.
- 95During the data cleaning phase, we also found that a small fraction of response times (1.08 percent) were zero. We coded these values as missing as well.