A Decision Theoretic Approach to Understanding Survey Response: Likert vs. Quadratic Voting for Attitudinal Research
“Likert items” are standard and widespread survey instruments. The most common version asks respondents to evaluate a statement by picking one of 5 (or 7) ordered responses ranging from strongly agree to strongly disagree. To interpret these answers, researchers often assume that respondents are sincere and report their true opinion with some random error. Yet, sincerity is not the only motive driving repondents’ answers. Competing motives, most famously motives related to partisan identity, also matter. We propose a simple decision-theoretic model of survey answers that incorporates these different types of motives. We first show that respondents can systematically exagerate their views when asked about them using Likert items. We then show how, under certain conditions, Quadratic Voting for Survey Research (QVSR) can minimize this bias.
I. Introduction
At its heart, survey research tries to understand what individuals think and know about the world. Policymakers and social scientists conduct polls because they want to know what the public “thinks” on a given set of policy issues. This information can be used by policymakers to inform their decisions on specific policies. It is also used normatively by political scientists as a benchmark to judge the “quality” of democratic politics in a given policy arena.1 For example, in the area of gun policy, political scientists rely on the gap between public opinion2 and policy to conclude that interest groups, such as the National Rifle Association, must be “capturing” the policy process to impose their preferences on democratic majorities.3 This line of work relies on the assumption that surveys successfully measure preferences on political or economic issues.
Most surveys rely on some variant of the Likert item, a survey technology developped in the 1930s by the psychologist Rensis Likert. Survey respondents are asked to evaluate a policy statement by picking one of five (or seven) ordered responses ranging from strongly agree/favor to strongly disagree/oppose. To interpret survey answers as a measure of “true” preferences, researchers need to assume that respondents are sincere when they pick a response category. Yet, there are good reasons to think that respondents’ answers are shaped by additional motives and that these motives can conflict with respondents’ desire to be sincere.
One motive examined by Professors John G. Bullock, Alan S. Gerber, Seth J. Hill, and Gregory A. Huber is partisan cheerleading.4 They show that in surveys, strong partisans purposefully misreport facts about the state of the economy out of a desire to praise one party or criticize another. When this partisan motive is repressed (using monetary incentives to provide what one beliefs to be the true response), actors revert to answers that are closer to the “truth” and less predicted by their partisan identity.5 These results indicate that when partisan cheerleading provides more utility than the sincerity motive, the observed answer will be different from respondents’ true beliefs.
In a related paper, Professors Carlos Berdejó and Daniel L. Chen find that, in weeks prior to United States presidential elections, judges on the US Courts of Appeals double the rate at which they dissent and vote along partisan lines.6 It is unlikely that the judges’ conception of a just decision has suddenly changed in the period preceding the election. What has changed is the possible returns of partisan cheerleading over sincerity. If highly experienced professionals making common-law precedent exhibit such a strong partisan bias, there is reason to believe that lay citizens answering political surveys (a comparatively low stake decision) should also, when faced with a conflict between signaling partisan and responding sincerily, deviate from expressing sincere beliefs or preferences.
In this article, we propose a simple and parsimonious decision-theoretic model of survey answers, which includes both the sincerity motive and other competiting motives. We use this model to better understand how the match between true unobservable attitudes and observed survey answers varies with the survey instrument. We formally show that respondents are likely to systematically inflate their views when those are measured using Likert items.
We also examine an alternative survey technology, Quadratic Voting for Survey Research (QVSR). The QVSR instrument gives respondents a fixed budget to “buy” votes in favor or against a set of issues. Because the price for each vote is quadratic, it becomes increasingly costly to acquire additional votes to express support or opposition to the same issue. In a first exploration, Professor David Quarfoot and his co-authors compare QVSR to Likert-based survey instruments by randomly assigning respondents to one method or the other on M-Turk.7 We complement this empirical approach by proposing a decision-theoretic analysis of the performance of QVSR versus Likert items.
The paper contributes to existing research on quadratic voting (QV). In its original formulation, QV is intended as a means of arriving at efficient social decisions when voting on policies that will be implemented.8 Professor Steven P. Lalley and E. Glen Weylprimarily assume that influencing policy is the main motivation of citizens.9 In contrast, we model the implications of QV in a very different context: survey research. In addition, we explicitly model other potential motives such as a sincerity motive and a partisan motive.10 We formally study how respondents solve the tradeoff between these potentially conflicting motives, depending on the survey instruments (Likert or QVSR). The model helps clarify the pros and cons of each survey intrument. Assuming the goal is to measure “true” attitudes, we lay out the conditions under which QVSR will outperforms Likert items.
II. A Decision-Theoretic Model of Survey Answers
Consider a number of policy issues, on which citizens may have any opinion between two extreme antagonistic positions. A survey is run to evaluate where the citizens stand on each of these issues. In this paper, extreme should not be understood in terms of how radical the proposition is. Instead in the spirit of Likert items, extremity measure the extent to which one agrees with (supports) or disagrees with (opposes) a clearly defined proposal.
A. Respondents’ Motivation When Answering Surveys
We assume that an individual may have (at least) two (potentially) conflicting motives when answering the survey. On the one hand, she derives some intrinsic utility from reporting her “true opinion” on each issue. This might derive from some expressive benefits (“I am happy to tell what my opinion is”), or this might be induced by a psychological cost of lying. We call this motive the “sincerity motive.” This is the motive generally assumed in the literature using survey data.11
On the other hand, we hypothesize that an individual may also care about how her answers will be read and interpreted by other people, which might conflict with this sincerity motive. This additional motivation might encompass a variety of psychological mechanisms, depending on the context and the question. For example, imagine that the government is considering whether a specific reform should be adopted or not, and that a survey is conducted to measure public support for or opposition to this reform. The respondent might be willing to strategically use her answers to the survey to influence policy making. Another motivation for the respondent might be to signal to herself, or to whoever is going to read the survey, that she has some socially desirable traits. For example, she may want to appear altruistic, non-racist, tolerant, etc. She might also want to signal a group identity. For example, if she is a Republican, and she expects Republicans to take specific positions on some issues, she may suffer a psychological cost from moving away from these typical “Republican positions.” The partisan cheerleading mentioned by Professor Bullock and coauthors might thus be some combination of an identity motive (behave like a Republican) and an influence motive (get Republican policies passed). Whatever the source of this motivation, because of this “signaling motive,” one position is particularly attractive to the respondent, which might be different from where she really stands.
B. The Utility Function
To capture these two motivations (sincerityand signaling), we propose a simple general model describing how respondents answer surveys.12
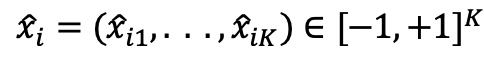
Assume a survey is run to measure respondents’ views on ![]() different policy issues. A position on any such issue is modeled as a real number in the interval
different policy issues. A position on any such issue is modeled as a real number in the interval ![]() , where the extreme positions
, where the extreme positions ![]() and
and ![]() denote perfect agreement with two opposite position on a given policy issue.13
We assume that, on each issue
denote perfect agreement with two opposite position on a given policy issue.13
We assume that, on each issue ![]() , respondent
, respondent ![]() is characterized by two parameters also lying in the interval
is characterized by two parameters also lying in the interval ![]() , her “true” opinion, denoted by
, her “true” opinion, denoted by ![]() , and the opinion she finds the most attractive because of the signaling motive, denoted by
, and the opinion she finds the most attractive because of the signaling motive, denoted by ![]() . We call the latter her “signaling target.”
. We call the latter her “signaling target.”
We assume that the utility a respondent derives from answering the survey, denoted by ![]() , depends on her answers to the survey (her reported policy positions), denoted by
, depends on her answers to the survey (her reported policy positions), denoted by
, in the following way:
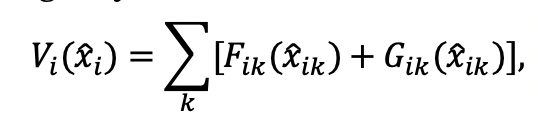
where functions Fik and Gik are single-peaked, and reach their maximum in ![]() and
and ![]() respectively. The first term in the utility function captures the sincerity motive. If for a given issue only this motive were present, the maximal utility an individual could get would be by reporting her true opinion on this issue. The second term on the right-hand side represents the signaling motive. If only this motive were present, the maximal utility an individual could get would be by reporting her signaling target. For the time being, we make no additional assumptions on functions
respectively. The first term in the utility function captures the sincerity motive. If for a given issue only this motive were present, the maximal utility an individual could get would be by reporting her true opinion on this issue. The second term on the right-hand side represents the signaling motive. If only this motive were present, the maximal utility an individual could get would be by reporting her signaling target. For the time being, we make no additional assumptions on functions ![]() and
and ![]() and on the signaling targets
and on the signaling targets ![]() . In what follows, we will consider in more detail two examples of particular interest, one where the signaling motive is induced by a desire to influence policy, and the other where it is induced by a partisan identity.
. In what follows, we will consider in more detail two examples of particular interest, one where the signaling motive is induced by a desire to influence policy, and the other where it is induced by a partisan identity.
C. Survey Technology
The survey technology constrains survey respondents by specifying the set of answers that are admissible, that is, the set of answers the respondents can choose from. For example, under standard Likert items, a respondent can pick any answer on a pre-determined number of ordered responses (for example, “strongly oppose,” “somewhat oppose,” “neither oppose nor support,” “somewhat support,” “strongly support”). Under Quadratic Voting, there is a maximum number of points that the respondent can use to answer, and the marginal cost of moving away from the neutral answer (here ![]() ) increases linearly with the distance to this neutral answer.
) increases linearly with the distance to this neutral answer.
D. Optimization Problem
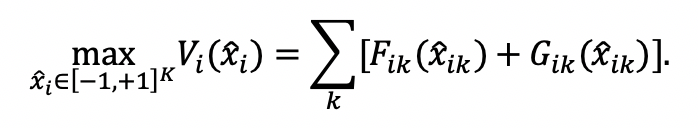
Individuals are assumed to choose answers (![]() ) that maximize the utility function
) that maximize the utility function ![]() , subject to the constraints on answers imposed by the survey technology. Equipped with this very simple model, we can predict how respondents will answer the survey. In particular, our interest will be to discuss whether these reported views are a good measure of the “true opinion” (
, subject to the constraints on answers imposed by the survey technology. Equipped with this very simple model, we can predict how respondents will answer the survey. In particular, our interest will be to discuss whether these reported views are a good measure of the “true opinion” (![]() ). In the next section we describe answers under Likert items, and then turn to the QVSR technology in the following section.
). In the next section we describe answers under Likert items, and then turn to the QVSR technology in the following section.
III. Properties of Optimal Answers under Likert Items
We consider first the case of Likert items. For simplicity, we will ignore the fact that there are in general only a discrete number of answers the respondent can choose from (“strongly favor”, “somewhat favor”, etc.); we will instead assume that she can pick any number in the ![]() interval. In that case, the set of admissible answers is simply
interval. In that case, the set of admissible answers is simply ![]() and the individual solves the following optimization program:
and the individual solves the following optimization program:
Denote by ![]() the solution of this program.
the solution of this program.
A. Properties of the Optimal Responses
It is straightforward to check that the optimal answer on issue ![]() (
(![]() ) lies somewhere between
) lies somewhere between ![]() and
and ![]() (that is, in the interval
(that is, in the interval ![]() if
if ![]() and in the interval
and in the interval ![]() otherwise). Otherwise, the respondent could simultaneously improve on both objectives. Where exactly she will locate between these two positions depends on the shape of the functions
otherwise). Otherwise, the respondent could simultaneously improve on both objectives. Where exactly she will locate between these two positions depends on the shape of the functions ![]() and
and ![]() .
.
1. Concave sub-utility functions.
In particular, if the functions ![]() and
and ![]() are both concave with
are both concave with ![]() , there is a strictly interior solution. With Likert items, individuals answer by compromising between their two motives. Answers incorporate information about both
, there is a strictly interior solution. With Likert items, individuals answer by compromising between their two motives. Answers incorporate information about both ![]() and
and ![]() .
.
2. Convex sub-utility functions.
By contrast, if the functions ![]() and
and ![]() are both convex, then the objective
are both convex, then the objective ![]() is convex in
is convex in ![]() and the individual either truthfully reports her true opinion
and the individual either truthfully reports her true opinion ![]() on this issue, or she reports her “signaling target,”
on this issue, or she reports her “signaling target,” ![]() .14
.14
B. Systematic Misreporting and What It Means for Often Used Common Measurement Error Approaches
One assumption commonly made by social scientists using political survey data is that surveys using Likert items provide a faithful—if noisy—measure of respondents’ “true” views.15 Most ofthe emphasis is on measurement error due to “format and survey context, errors made by respondents, and so on.”16 One suggestion is to minimize measurement error by constructing a scale that combines similar Likert items.17 This assumes that the covariance in the error term across Kissues of the same “issue area” is zero.
In contrast, our model highlights the fact that respondents may instead deviate from their true views in systematic ways due to the signaling motives. As a result, misreporting (or “error”) will be correlated across items: combining these items into a scale or index will not address the bias introduced by these signaling motives.
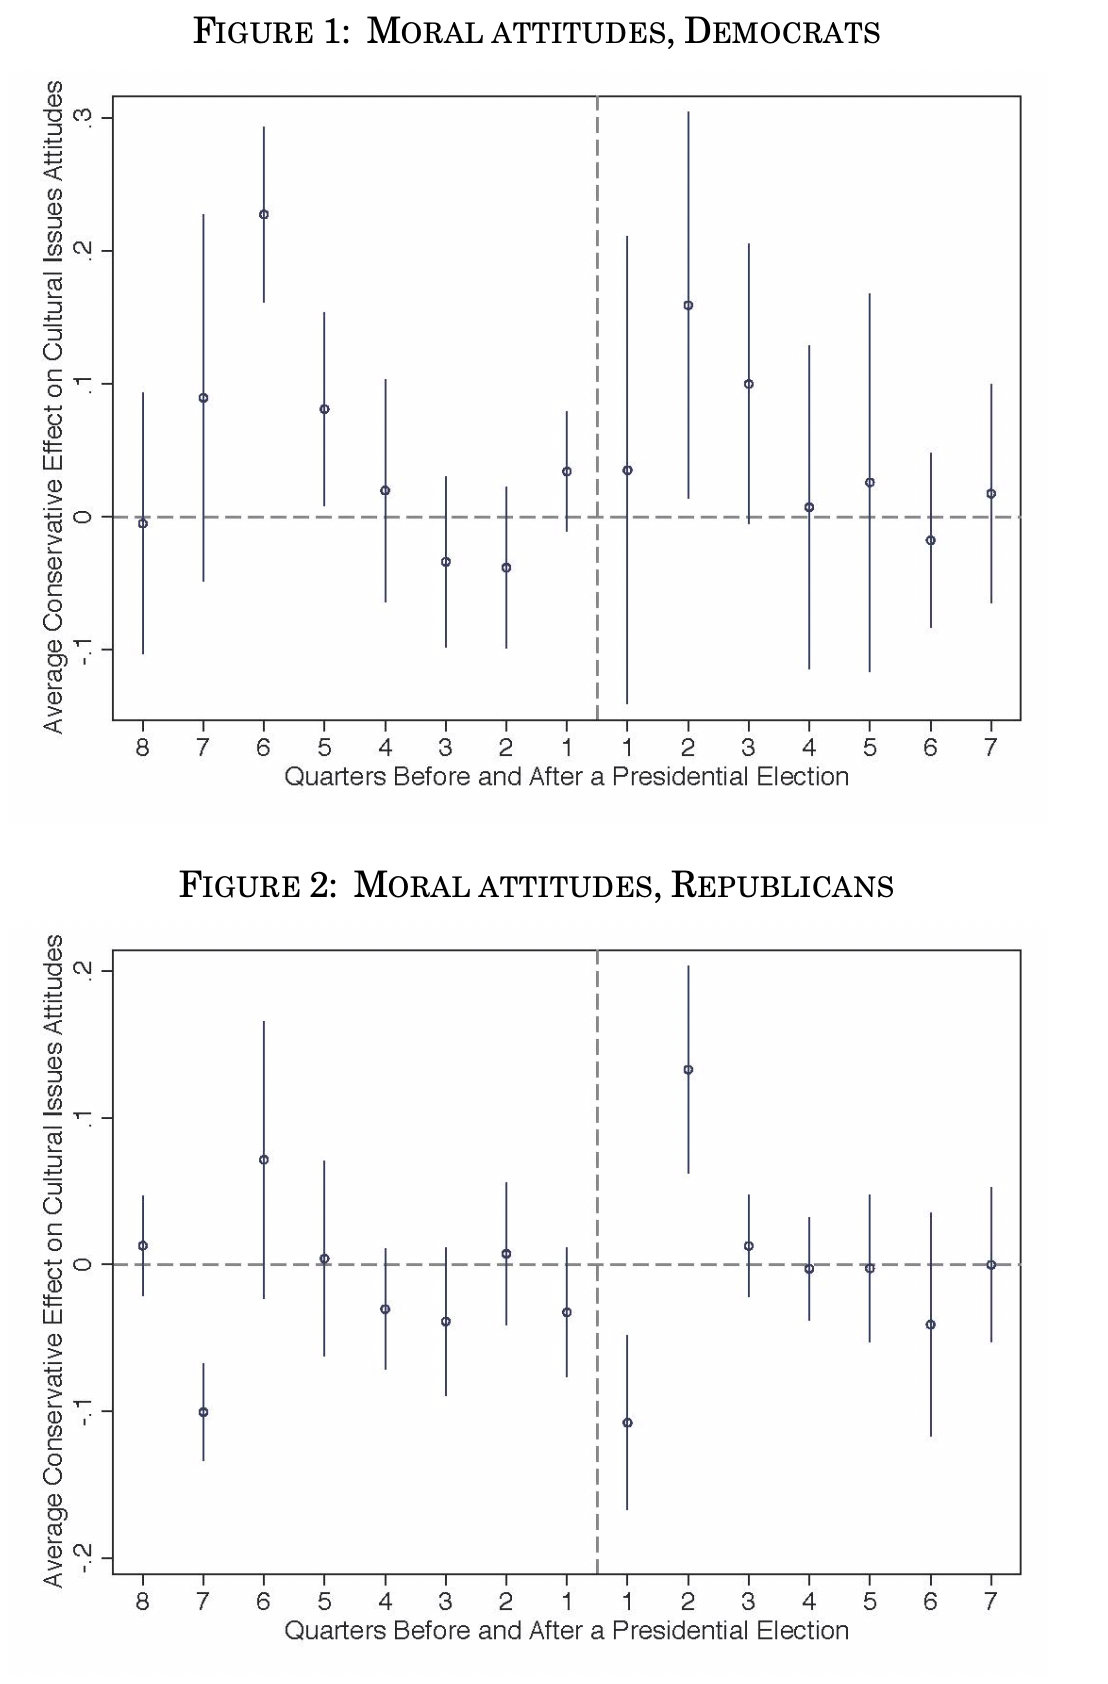
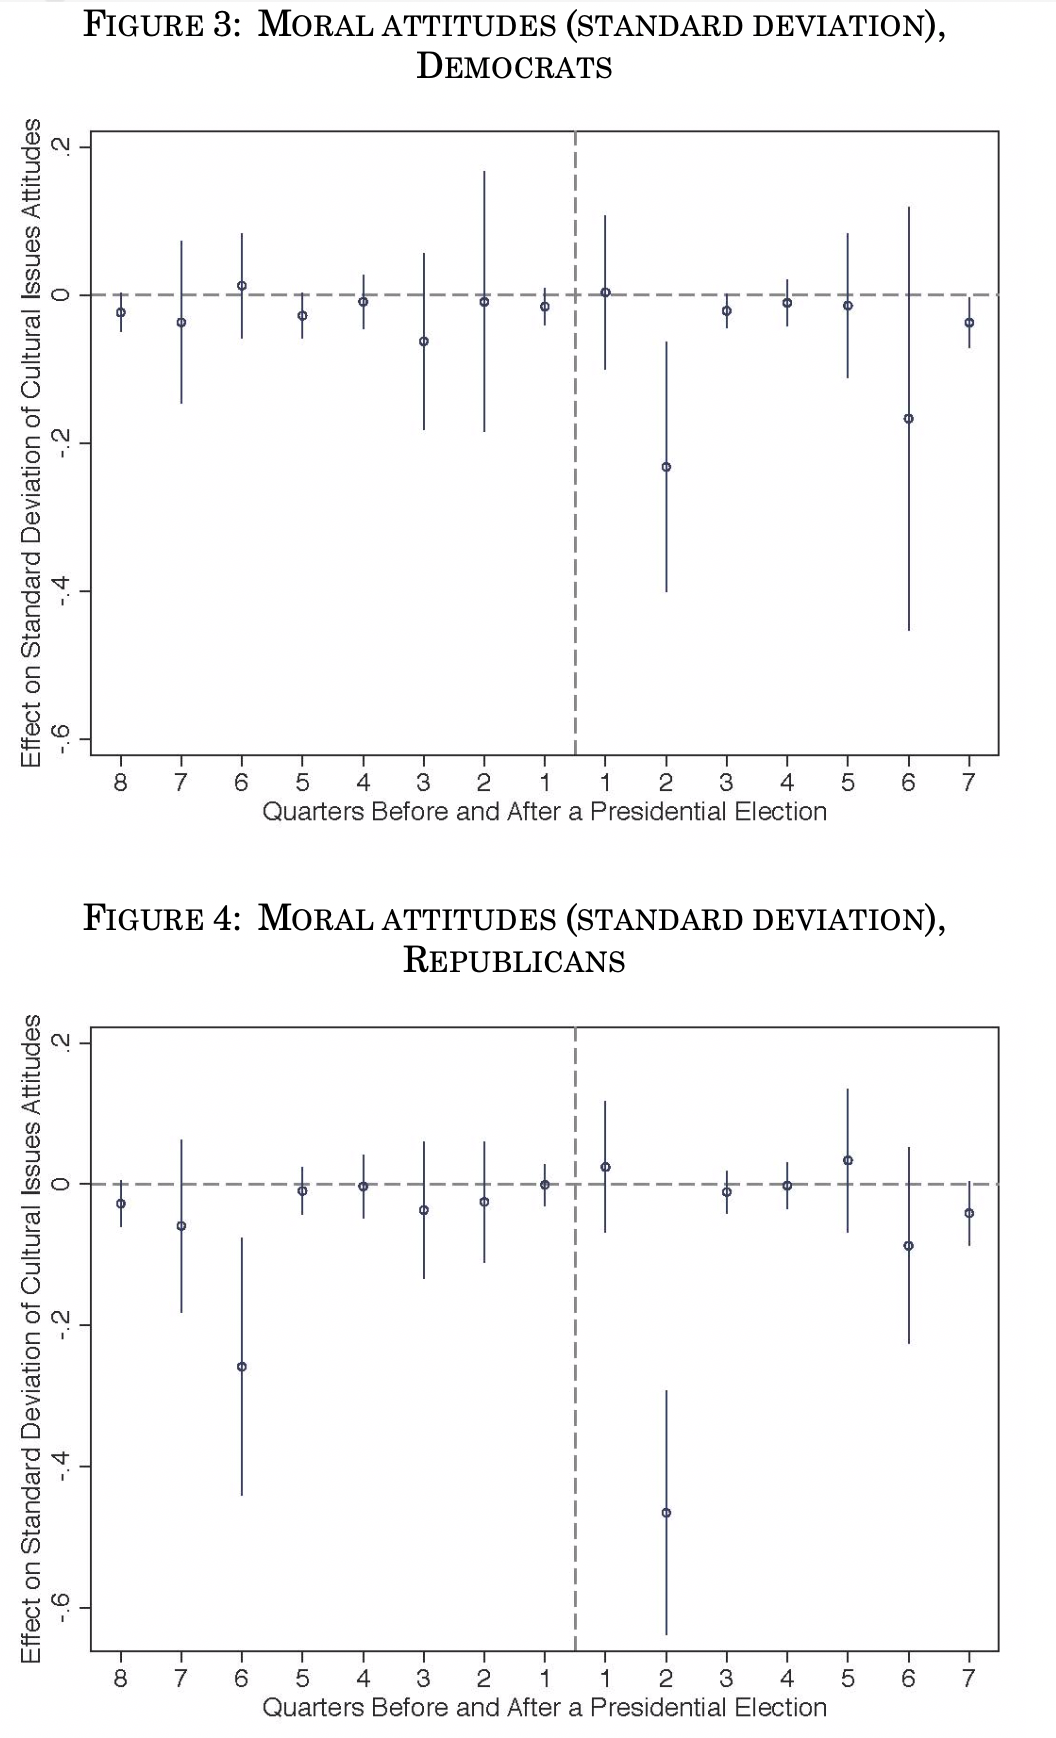
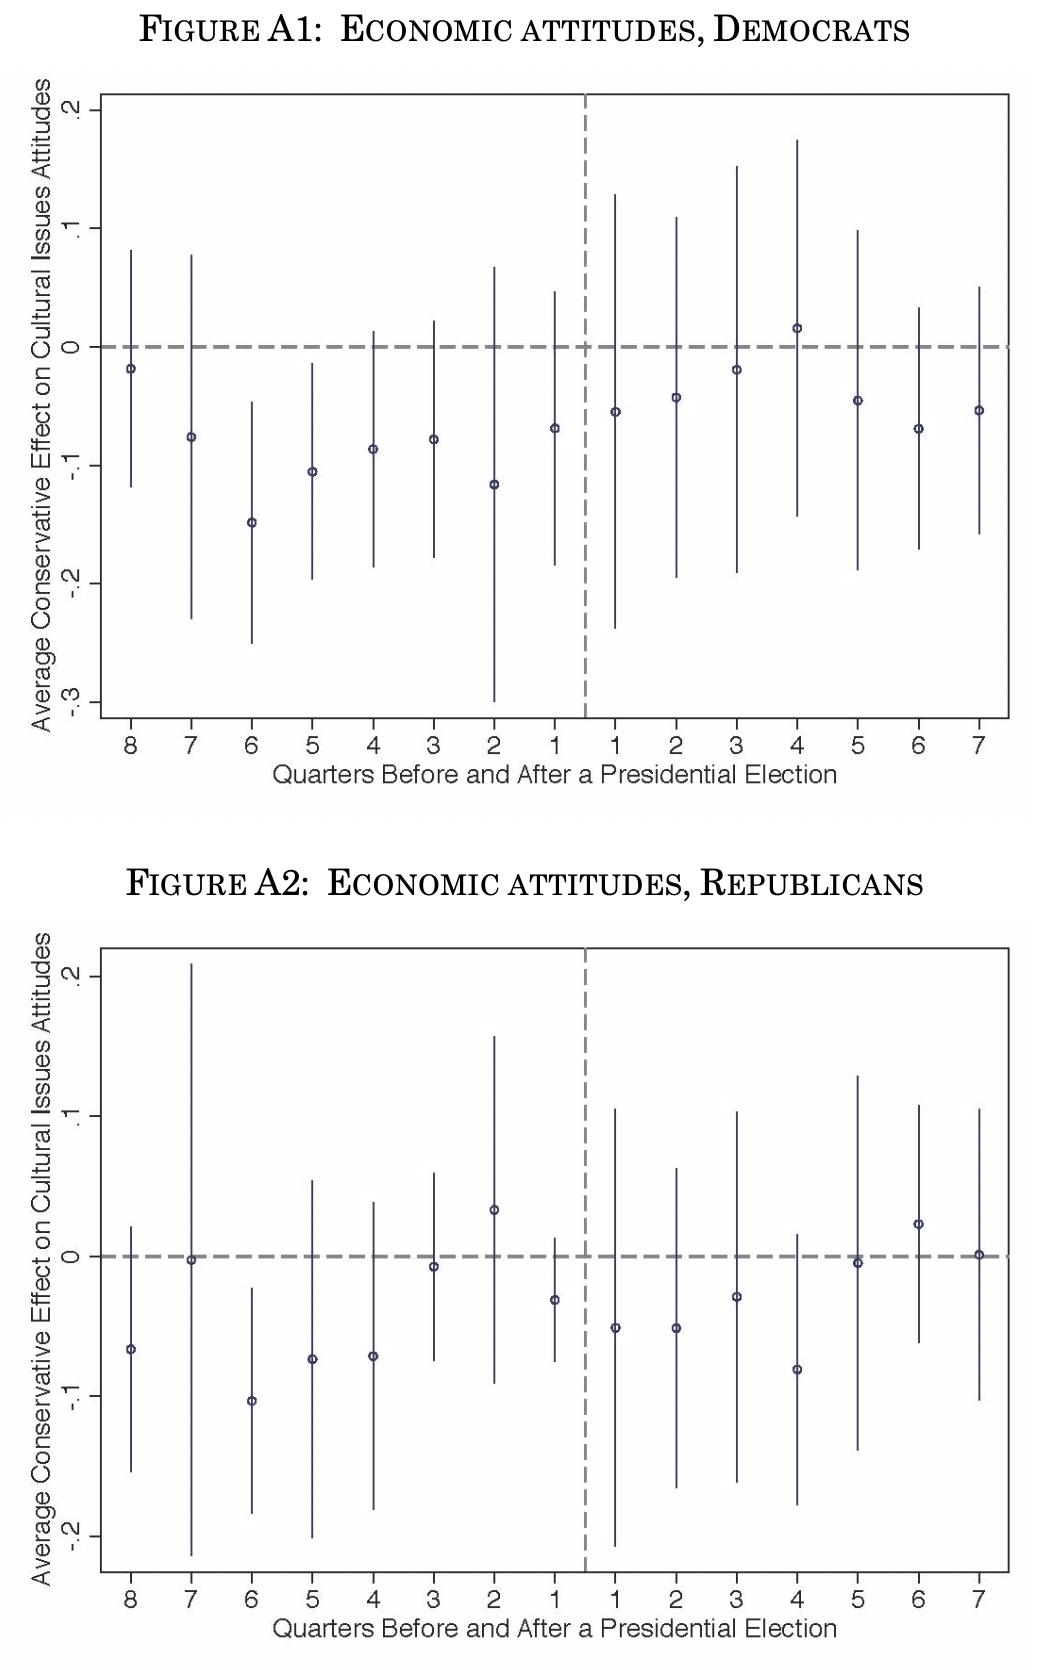
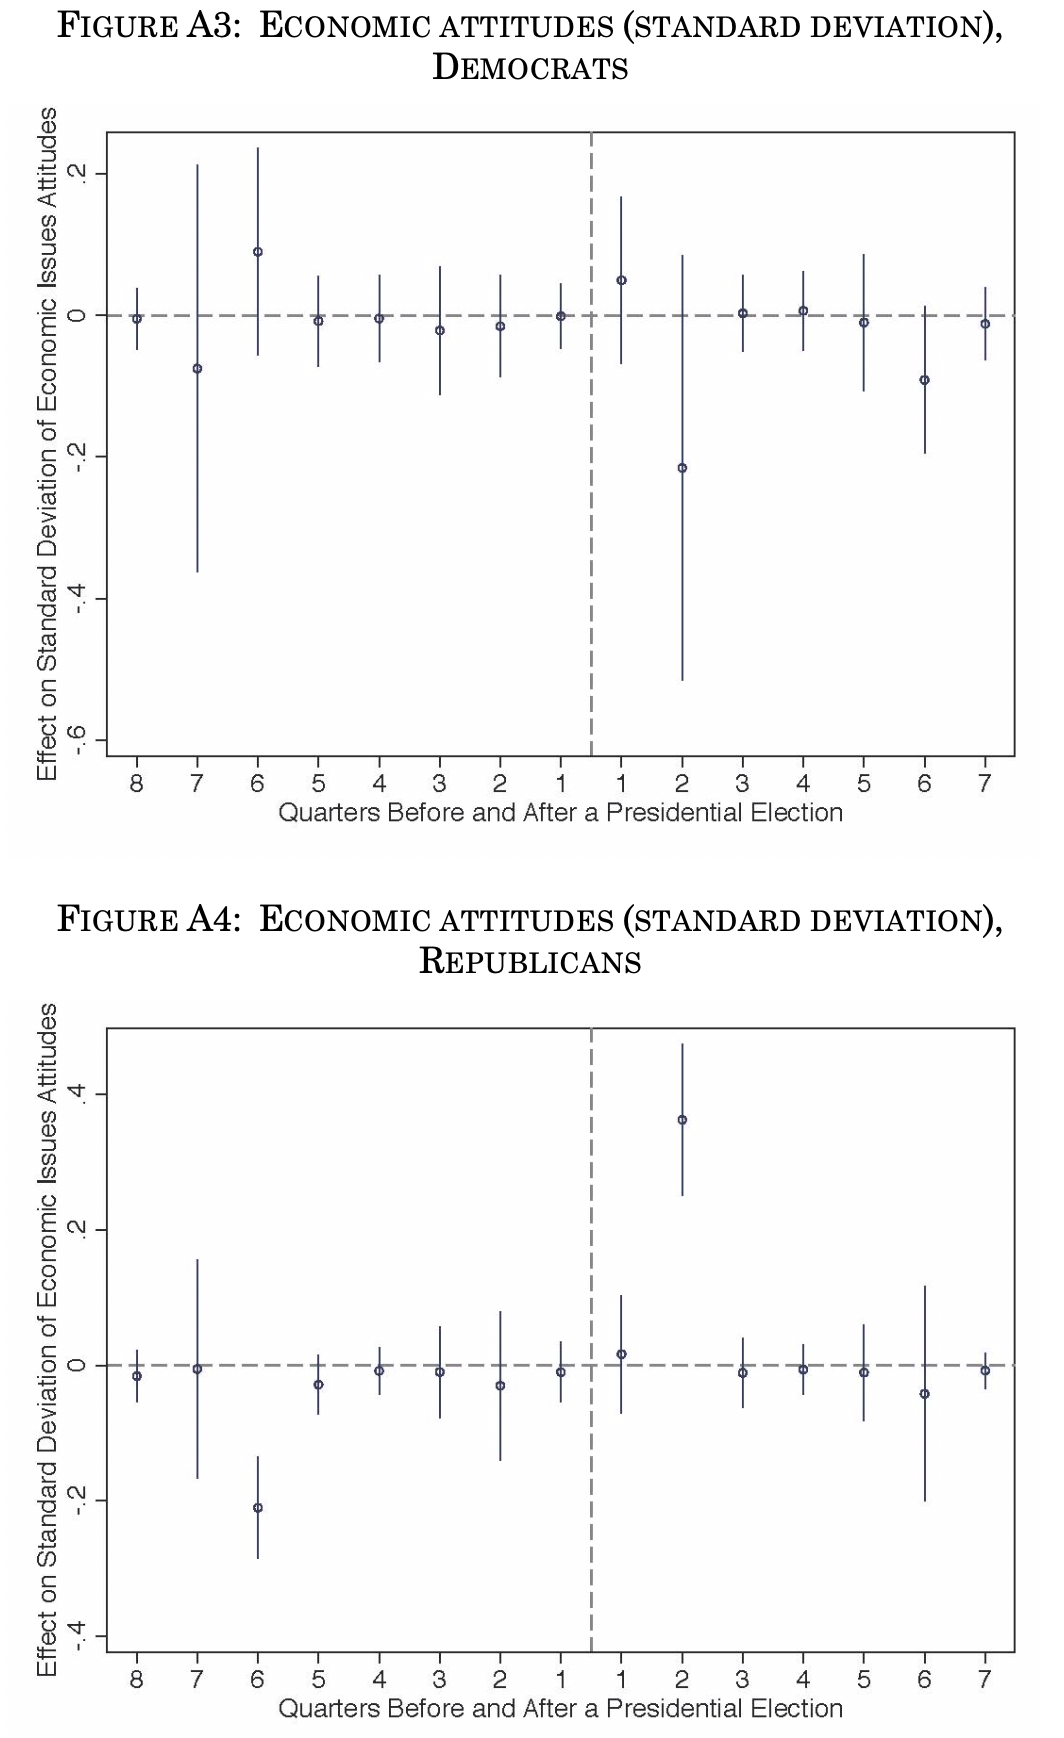
To illustrate this point, we document attitudinal patterns that are inconsistent with the dominant view of attitudes being measured only with random error. We present electoral cycles in such Likert indices developed by Professors Stephen Ansolobehere, Jonathan Rodden, and James M. Snyder Jr to measure economic and moral attitudes.18 We use the General Social Survey’s date of interview and cluster standard errors by year of interview. Each subsequent figure presents specifications with a full set of quarter-to-elect dummy indicators omitting quarter 16 (so November–January after an election is the comparison group), and also controls for seasonality (January–March, April–June, July–September, October–December). Figure 1 shows that Democrats are systematically more culturally conservative two quarters after a presidential election and two quarters after a midterm election (May–July). Figure 2 shows that Republicans are more culturally liberal one quarter after these elections. In the appendix, the corresponding patterns for economic attitudes are less pronounced, with both groups being more economically liberal two quarters after midterms. Next we analyze group cohesion as it varies over the electoral cycle. We calculate the average standard deviation in responses to each question for Democrats and for Republicans. Figure 4 shows that two quarters after elections, Republicans have more within-group cohesion on cultural issues. Figure 3 shows a similar pattern for Democrats two quarters after presidential elections. In the appendix, the pattern for economic attitudes are less systematic, though patterns still appear two quarters after elections (Fig. A1–A4). These patterns seem to contradict the hypothesis of random errrors.
When political opinions are measured using Likert items, there are a number of issues on which some respondents are likely to systematically misreport their true views. What can be said about the direction of this deviation? Will individuals appear in their answers to be more or less extreme than what they really are? In full generality, this deviation can go in any direction, depending on the relative position of the true opinion (![]() ) and of the partisan target (
) and of the partisan target (![]() ). Indeed, if
). Indeed, if ![]() then respondents will appaear more extreme. In the next two sections, we study two such situations where “systematic exaggeration” is likely to occur, and discuss wether quadratic voting might help alleviate this problem.
then respondents will appaear more extreme. In the next two sections, we study two such situations where “systematic exaggeration” is likely to occur, and discuss wether quadratic voting might help alleviate this problem.
IV. The “Policy Influence Motive”
One possible systematic exaggeration if when an individual wants to influence the decisions made by the government on issue ![]() . The government is more likely to pay attention if surveys indicate full support for the reform. In other words, the target is
. The government is more likely to pay attention if surveys indicate full support for the reform. In other words, the target is ![]() if
if ![]() , and
, and ![]() if
if ![]() , and there will be a strategic inflation in the reported intensity. In the polar case where this policy influence motive is predominant, respondents will bunch at the extreme points of the Likert item.
, and there will be a strategic inflation in the reported intensity. In the polar case where this policy influence motive is predominant, respondents will bunch at the extreme points of the Likert item.
A. Assumptions
To be more specific about the context, assume that ![]() independent binary decisions have to be made by the government, say, implement a given reform or keep the status quo. In that case,
independent binary decisions have to be made by the government, say, implement a given reform or keep the status quo. In that case, ![]() is to be interpreted as the utility derived by individual
is to be interpreted as the utility derived by individual ![]() if reform
if reform ![]() is implemented (compared to the status quo). Assume that a survey is run to evaluate the total utility that the implementation of each of the
is implemented (compared to the status quo). Assume that a survey is run to evaluate the total utility that the implementation of each of the ![]() reforms is likely to generate. We assume that the signaling part of the utility function has the following form:
reforms is likely to generate. We assume that the signaling part of the utility function has the following form: ![]() where
where ![]() is the probability that the reform is implemented if the individual reports
is the probability that the reform is implemented if the individual reports ![]() (with
(with ![]() ). Note that in the strategic signaling motive, this “influence function”
). Note that in the strategic signaling motive, this “influence function” ![]() is weighted by how much the respondent is impacted by the reform (
is weighted by how much the respondent is impacted by the reform (![]() ). To derive some simple closed-form solutions, we make the following assumptions:
). To derive some simple closed-form solutions, we make the following assumptions:
,
where parameter ![]() captures the marginal impact of
captures the marginal impact of ![]() on the decision making process, and parameter
on the decision making process, and parameter ![]() describes the weight of the sincerity versus signaling motive on issue
describes the weight of the sincerity versus signaling motive on issue ![]() .
.
B. Optimal Responses under Likert
Under Likert, it is easy to check that the optimal answers are in that case:
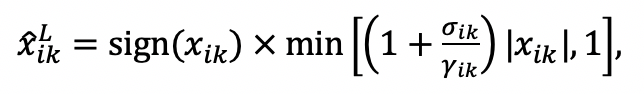
(1)
where sign![]() if
if ![]() and sign
and sign![]() if
if ![]() . Expression (1) shows that the optimal answer has the same sign as the ‘true preference’ (no misreporting in the direction of the preferences), but the intensity is always exaggerated. The size of the exaggeration is increasing with the ratio
. Expression (1) shows that the optimal answer has the same sign as the ‘true preference’ (no misreporting in the direction of the preferences), but the intensity is always exaggerated. The size of the exaggeration is increasing with the ratio ![]() . When this ratio becomes large enough, the individual will choose to locate at one of the extremities of the [-1 , 1] scale. When such bunching occurs (in particular when only the policy influence motive is present
. When this ratio becomes large enough, the individual will choose to locate at one of the extremities of the [-1 , 1] scale. When such bunching occurs (in particular when only the policy influence motive is present![]() ), the only information that can be learned with the Likert technology is the direction of the preference; nothing can be learnt about intensity. Note that this is the situation originally motivating the use of quadratic voting in the seminal work of Lalley and Weyl.19
), the only information that can be learned with the Likert technology is the direction of the preference; nothing can be learnt about intensity. Note that this is the situation originally motivating the use of quadratic voting in the seminal work of Lalley and Weyl.19
C. Optimal Responses under QVSR
One solution to this problem of strategic exaggeration might be to make reporting extreme values more costly than reporting moderate values. This is the basic idea underlying QVSR.20 Formally, assume that the set of feasible answers under QVSR is:
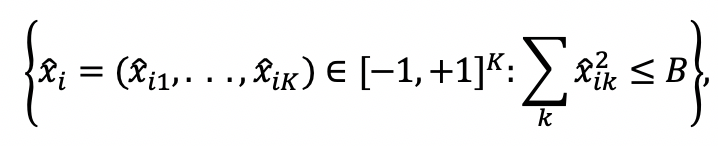
where ![]() .
.
Deriving the optimal answers under QVSR is more complicated since it involves solving a constrained maximization program. The details of the proof are relegated in a technical appendix. As one can check in the appendix, the optimal response on issue ![]() under QVSR is:
under QVSR is:
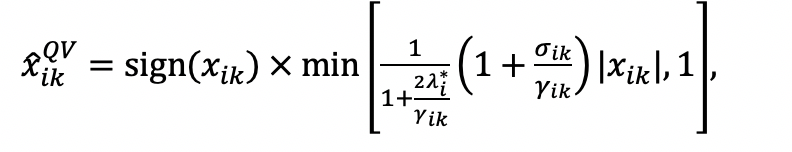
(2)
where ![]() is the Lagrange multiplier at the optimum. If
is the Lagrange multiplier at the optimum. If ![]() , meaning that optimal answers under Likert are within the QVSR budget set, then
, meaning that optimal answers under Likert are within the QVSR budget set, then ![]() and
and ![]() . If
. If ![]() , optimal answers under Likert are not admissible under QVSR, and the individual has to report less extreme views.
, optimal answers under Likert are not admissible under QVSR, and the individual has to report less extreme views.
D. Relative Performance of Likert and QVSR
As intuition suggests, the relative performance of Likert vs QVSR depends on the relative strength of the sincerity motive and policy influence motive. If the policy influence motive is very weak compared to the sincerity motive (i.e. ![]() close to
close to ![]() ), Likert items provide a good measure of preferences (see (1)). Indeed, reported views will be close to true opinions, with little bunching at extreme positions on the ordered responses. In that case, QVSR is not needed, and will even undermine the quality of the measure of preferences, since the binding budget constraint will prevent some respondents to report their true preferences.
), Likert items provide a good measure of preferences (see (1)). Indeed, reported views will be close to true opinions, with little bunching at extreme positions on the ordered responses. In that case, QVSR is not needed, and will even undermine the quality of the measure of preferences, since the binding budget constraint will prevent some respondents to report their true preferences.
By contrast, if the policy influence motive is strong enough, Likert will provide a poor measure of the intensity of preferences, because strategic considerations will induce respondents to bunch at extreme values. In that case, QVSR might represent a substantial improvement over Likert. Indeed, by making extreme reports more costly, it decreases the bunching at extreme positions observed with Likert, and is thus likely to generate better quality information about the intensity of preferences.
V. The “Partisan Consistency Motive”
A. Assumptions
When answering political surveys, the policy influence motive is not the only motive that may induce respondents to distort their true preferences. Another interesting example is a situation where citizens have strong partisan identities, and where even if they disagree with their preferred party’s position on a specific issue, they suffer a psychological cost from reporting a divergent opinion. We will call this motive the “partisan consistency motive.”21
In that case, their signaling target ![]() on an issue is the position of the party with which they identify.
on an issue is the position of the party with which they identify.
Imagine a situation where party elites are very polarized, and consider an individual who generally agrees with her preferred party regarding the “direction” of the policy (that is, ![]() and
and ![]() have the same sign on most issues), but who is generally less extreme (
have the same sign on most issues), but who is generally less extreme (![]() on most issues). Under Likert, such an individual, because she wants to look like a ‘good Republican’ or like a ‘good Democrat’, will pick more extreme answers than she would if she were just reporting truthfully her own opinion.
on most issues). Under Likert, such an individual, because she wants to look like a ‘good Republican’ or like a ‘good Democrat’, will pick more extreme answers than she would if she were just reporting truthfully her own opinion.
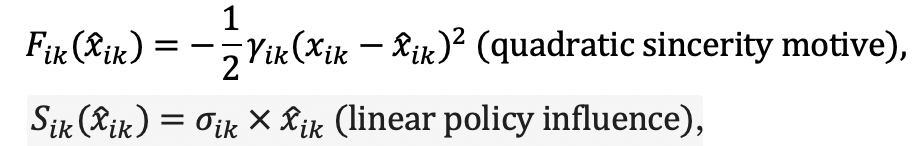
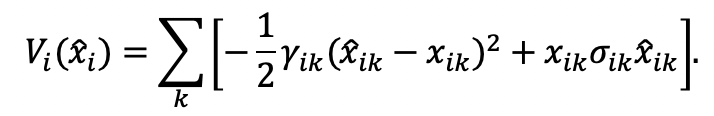
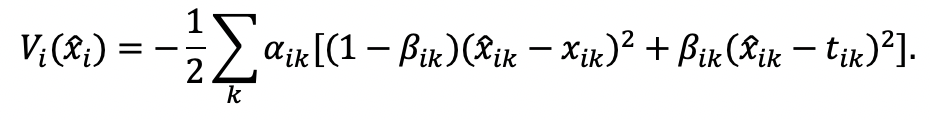
To derive some simple closed-form solutions, we study a simple example with quadratic sub-utility functions for both the sincerity and the signaling motives. We assume that the utility function ![]() is:
is:
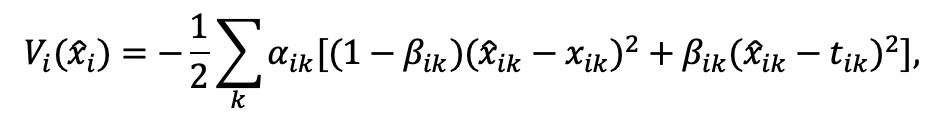
with ![]() and
and ![]() . Parameter
. Parameter ![]() is the importance put on issue
is the importance put on issue ![]() when answering the survey, and parameter
when answering the survey, and parameter ![]() is the relative weight of the partisan consistency motive compared to the sincerity motive for issue
is the relative weight of the partisan consistency motive compared to the sincerity motive for issue ![]() .
.
B. Optimal Responses under Likert
Under Likert technology, it is easy to check that the solution of this optimization program is:
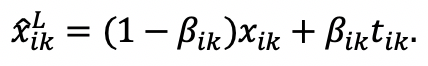
(3)
If ![]() (only the sincerity motive is active), the individual has no incentive to misreport her view, and
(only the sincerity motive is active), the individual has no incentive to misreport her view, and ![]() . But as soon as
. But as soon as ![]() , the individual has the incentive to move away from her true opinion in the direction of her partisan target.
, the individual has the incentive to move away from her true opinion in the direction of her partisan target.
Note that under Likert, how much the individual values her answer to this question compared to other questions in the survey (parameter ![]() ) does not influence her answers. Indeed, each question is treated in isolation.
) does not influence her answers. Indeed, each question is treated in isolation.
C. Optimal Responses under QVSR
Under QVSR technology, we show in the appendix that the optimal response on issue ![]() under QVSR is:
under QVSR is:
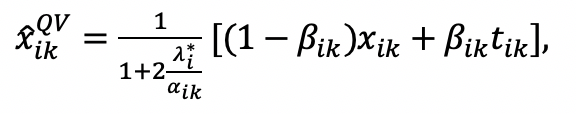
(4)
where ![]() is the Lagrange multiplier at the optimum.
is the Lagrange multiplier at the optimum.
D. Relative Performance of Likert and QVSR
Note first that, as in the case of the policy influence motive, if the partisan motive is very weak compared to the sincerity motive (i.e. ![]() close to
close to ![]() ), Likert items provide a good measure of preferences (see (3)). In that case again, QVSR is not needed, and will even undermine the quality of the measure of preferences, since the binding budget constraint will prevent some respondents to report their true preferences.
), Likert items provide a good measure of preferences (see (3)). In that case again, QVSR is not needed, and will even undermine the quality of the measure of preferences, since the binding budget constraint will prevent some respondents to report their true preferences.
Consider now cases where the partisan motive can be potentially strong. As soon as the budget constraint is binding, compared to Likert, QVSR “shrinks” all answers towards the neutral answer (![]() ). Expression (4) shows that this “contraction” can be heterogenous across issues: more points will be given to issues with a higher
). Expression (4) shows that this “contraction” can be heterogenous across issues: more points will be given to issues with a higher ![]() , meaning that respondents will put more points on issues that they consider as important. In that case, the relative performance of QVSR vs. Likert at measuring “true” opinions depends on the statistical relationship between
, meaning that respondents will put more points on issues that they consider as important. In that case, the relative performance of QVSR vs. Likert at measuring “true” opinions depends on the statistical relationship between ![]() (the importance of the issue) and
(the importance of the issue) and ![]() (the relative importance of the partisan motive compared to the sincerity motive). Depending on this relationship, either method can dominate.
(the relative importance of the partisan motive compared to the sincerity motive). Depending on this relationship, either method can dominate.
If, for an individual, the ![]() are the same for all issues, expression (4) shows that the optimal answers under QVSR are given, compared to Likert, by just ‘shrinking’ all answers proportionally towards the neutral answer (
are the same for all issues, expression (4) shows that the optimal answers under QVSR are given, compared to Likert, by just ‘shrinking’ all answers proportionally towards the neutral answer (![]() ), until one satisfies the budget constraint.22
), until one satisfies the budget constraint.22
- 1See generally, for example, Martin Gilens, Affluence and Influence: Economic Inequality and Political Power in America(Princeton 2012).
- 2In the past three decades, an average of two-thirds of American citizens surveyed have indicated support for making gun control regulations stricter. See Guns, (Gallup 2018), archived at http://perma.cc/UK3V-EA6C.
- 3In recent work on regulatory capture, Professor Daniel Carpenter similarly relies on public opinion polls to measure the influence of interest groups. He argues that political scientists first need to measure majority preferences and then look for evidence of interest groups moving policy away from these views to detect policy capture. This approach to survey data has been used in diverse areas, such as environmental, worker safety, food and drug, and labor regulations. Daniel Carpenter, Detecting and Measuring Capture, in Daniel Carpenter and David A. Moss, eds, Preventing Regulatory Capture: Special Interest Influence and How to Limit It(Cambridge 2014). For further analysis of the gap between public opinion polls and legislative action, see Gilens, Affluence and Influence(cited in note 1).
- 4See generally John G. Bullock, et al, Partisan Bias in Factual Beliefs about Politics, 10 Q J Pol Sci 519 (2015).
- 5Id at 563.
- 6Carlos Berdejó and Daniel L. Chen, Electoral Cycles Among U.S. Courts of Appeals Judges, 60 J L & Econ 479, 486 (2017).
- 7David Quarfoot, et al, Quadratic Voting in the Wild: Real People, Real Votes, 172 Pub Choice 283 (2016).
- 8See E. Glen Weyl, The Robustness of Quadrating Voting, 172 Pub Choice 75, 79–81 (2017).
- 9Id.
- 10Before moving on, one quick note to readers well versed in public opinion research: our emphasis is on the way in which survey technology affect the match between “true” and observed attitudes. In other words, unlike Professor John Zaller and scholars who build on his work, we are not examining the role motives such as partisan cheerleading plays in shaping a respondent’s underlying “true” attitude. Instead, we focus on the likelihood that this respondent will misreport it and how this likelihood might vary with the survey instrument. See generally, for example, Seth J. Hill, James Lo, Lynn Vavreck, and John Zaller, How Quickly We Forget: The Duration of Persuasion Effects from Mass Communication, 30 Pol Comm 521 (2013).
- 11One assumption commonly made by social scientists using survey data is that they provide a faithful—if noisy—measure of respondents’ views. See generally, for example, Christopher Achen, Mass Political Attitudes and the Survey Response, 69 Am Pol Sci Rev 1218 (1975); Stephen Ansolabehere, Jonathan Rodden, and James M. Snyder Jr, The Strength of Issues: Using Multiple Measures to Gauge Preference Stability, Ideological Constraint, and Issue Voting, 102 Am Pol Sci Rev 215 (2008).
- 12Our model shares some similarities with that of John G. Bullock, et al, Partisan Bias in Factual Beliefs about Politics, 10 Q J Pol Sci 519 (2015) (cited in note 4), which studies systematic differences between Republican and Democrat voters in how they answer factual questions about economic facts.
- 13We here follow the common practice in survey research to ask respondents to place themselves on a single dimension. This dimension might run from full agreement with a statement to full disagreement with the same statement. Another dimension often used is full agreement with a given statement (the government should be the only provider of healthcare services) and full agreement with its exact opposite (the government should have no role to play whatsoever in the prevision of healthcare services).
- 14More specifically, an individual chooses
 if and otherwise.
 - 15See, for example, Achen, 69 Am Pol Sci Rev at 1221 (cited in note 11); Ansolabehere, Rodden, and Snyder, 102 Am Pol Sci Rev at 216–17 (cited in note 11).
- 16Ansolabehere, Rodden, and Snyder, 102 Am Pol Sci Rev at 217 (cited in note 11).
- 17Id.
- 18Stephen Ansolabehere, Jonathan Rodden, and James M. Snyder Jr, Purple America, 20 J Econ Perspectives 97 (2006).
- 19See Weyl, 172 Pub Choice at 79–81 (cited in note 8).
- 20Id.
- 21When one’s preferred party is not in power, the partisan consistency motive can additively interact with the policy influence motive: one might overreport agreement with abortion rights both because it is the right thing to do as a Democrat and because one wants to influence Republican policy on this issue.
- 22More specifically, using condition (6) in the appendix, one can check that: If the partisan targets are more extreme than the respondents’ true views (), QVSR will move answers in the correct direction (compared to Likert). Yet, it is important to note that QVSR will not “purge” reported answers of the partisan motive: answers will still be a convex combination of the true opinion and the partisan target, with exactly the same relative weights as under Likert. In that sense, QVSR will not perform better than Likert.
If high
tend to be associated with low , more votes will be put on issues with a strong sincerity motive, and QVSR might perform better than Likert at measuring “true opinions.” There are reasons to expect such a positive correlation between the importance of the issue and the strength of the sincerity motive. Indeed, consider an individual who cares strongly about some issues, and considers others as secondary or not very important. On the former set of issues, the individual will be ready to collect information, invest some time and effort to think about the pros and cons of various policies, and eventually form a strong, independent opinion. For such issues, the sincerity motive is likely to be strong and the partisan motive weak. By contrast, consider the issues in the latter set. Such issues are issues the individual does not really care about and has not thoughtfully reflected upon. In that case, she might be happy to use the party line as the main determinant of her answers. To make this argument more clearly, consider the extreme case where there are two types of issues: those about which the individual cares and where the sincerity motive is predominant, say and , with , and those about which the individual does not care and where the partisan motive is predominant, say and . In that case, under Likert, the individual will report her true opinion on the first set of issues, and will report her partisan target on the second set (See (3)). Under QVSR, assuming that the budget constraint is sufficiently binding, she will put no points on the second set of issues, and she will allocate all her points on the issues with a strong sincerity motive. In such a situation, QVSR is likely to represent a significant improvement over Likert.Note last that if high
tend to be associated with high , the exact opposite argument will prevail and QVSR might perform worse than Likert.VI. Conclusion
We have good reasons to think that systematic biases in translating true into observed attitudes exist. We formally study how conflicting motives (more specifically, a sincerity motive, a policy-influence motive, and a partisan motive) may induce some tradeoffs when individuals answer survey questions. We show that QVSR performs better than Likert items on average when this bias generates bunching toward one or both ends of the ordered response categories, or when across issues, there is a positive correlation between the strength of the sincerity motive and the general importance of the question to the respondent. Yet, we also highlight several limits, which indicate that a specific set of assumptions need to be tested before being able to decide, for each specific context, which instrument dominates.
A.1 Optimal Responses under QVSR: The “Policy Influence”Case
Consider the “policy influence motive” case, with the following utility function:
Under QVSR, the individual maximizes her utility
subject to the budget constraint . Write the Lagrangian as: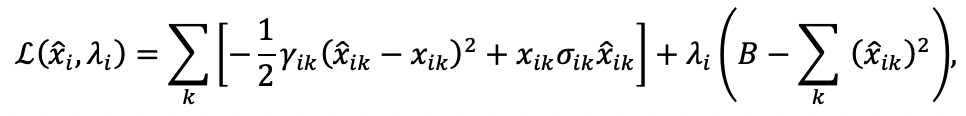
where
is the Lagrange multiplier. Taking the derivatives with respect to , one can check that the first order condition gives: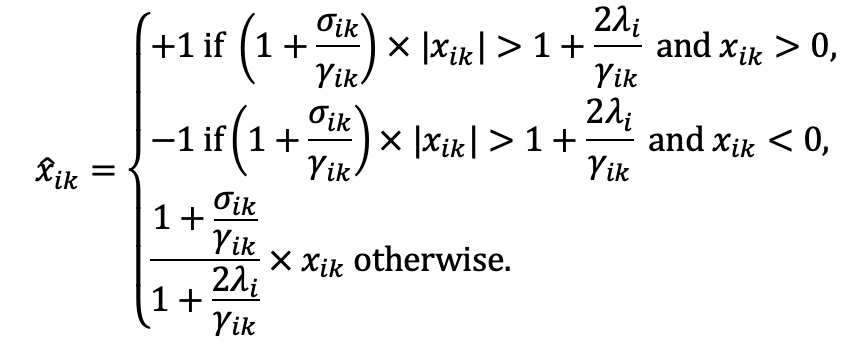
If
: responses are the same as under Likert (the budget constraint is not binding, and at the optimum the Lagrange multiplier is equal to ).(5)
If
, then satisfying the budget constraint implies that: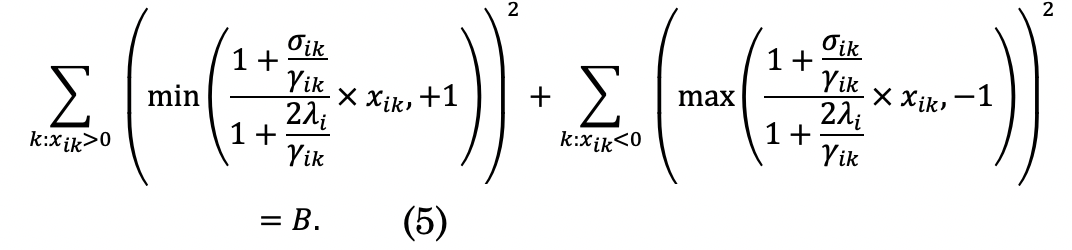
Note that the left-hand side of the equality is strictly decreasing in
. It takes the value when , and it converges towards as goes to . Therefore, there exists a unique positive such that equality (5) is satisfied. Note that this value depends on all the parameters , and on the true preferences . Denoting the Lagrange multiplier at the optimum by , under QVSR, the optimal response on issue is therefore: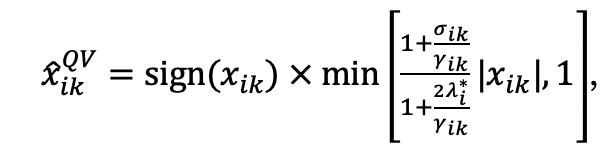
,
which is expression (2) in the main text.
A.2 Optimal Responses under QVSR: The “Partisan Consistency”Case
Consider the “partisan consistency motive” case, with the following utility function:
Under QVSR technology, the individual now solves the following optimization program:

,
where
is the Lagrange multiplier. First order condition with respect to now yields: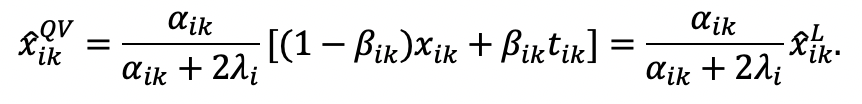
If
: responses are the same as under Likert (the budget constraint is not binding).If
, then satisfying the budget constraint implies that: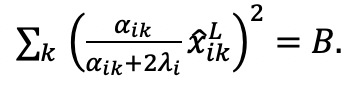
(6)
Note that the left-hand side of the equality is strictly decreasing in
, taking the value strictly higher than when , and is converging towards as goes to . Therefore, there exists a unique positive such that equality (6) is satisfied. Denoting the Lagrange multiplier at the optimum by , the optimal response on issue under QVSR is therefore: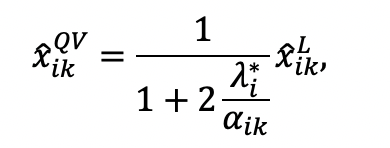
which is expression (4) in the main text.