Civil Rights in a Desegregating America
The law largely has overlooked one of the most important sociological developments of the last half century: a sharp decline in residential segregation. In 1970, 80 percent of African Americans would have had to switch neighborhoods for blacks to be spread evenly across the typical metropolitan area. By 2010, this proportion was down to 55 percent and was continuing to fall. Bringing this striking trend (and its causes) to the attention of the legal literature is my initial aim in this Article.
My more fundamental goal, though, is to explore what desegregation means for the three bodies of civil rights law—housing discrimination, vote dilution, and school segregation—to which it is tied most closely. I first explain how all three bodies historically relied on segregation. Its perpetuation by housing practices led to disparate impact liability under the Fair Housing Act. It meant that minority groups were “geographically compact,” as required by the Voting Rights Act. And it contributed to the racially separated schools from which segregative intent was inferred in Brown and its progeny.
I then argue that all of these doctrines are disrupted by desegregation. Fair Housing Act plaintiffs cannot win certain disparate impact suits if residential patterns are stably integrated. Nor can claimants under the Voting Rights Act satisfy the statute’s geographic compactness requirement. And desegregating homes usually result in desegregating schools, which in turn make illicit intent difficult to infer.
Lastly, I offer some tentative thoughts about civil rights law in a less racially separated America. I am most optimistic about the Fair Housing Act. “Integrated and balanced living patterns” are among the statute’s aspirations, and it increasingly is achieving them. Conversely, I am most pessimistic about the Voting Rights Act. One of its objectives is minority representation, which is threatened when minorities are politically distinctive but spatially dispersed. And a mixed verdict seems in order for school desegregation law. Rising residential integration eventually should produce rising school integration. But it has not done so yet, and even when it does, this improvement may not reach schools’ other racial imbalances.
I. Racial Segregation in America
This is an odd sort of law review article, premised as it is on a sociological phenomenon, racial desegregation, of which the legal literature is mostly unaware. Because of this oddity, I think it is necessary to document the phenomenon thoroughly before turning to what it means for civil rights law. This documentation is the purpose of this Part. I hope it will convince readers that a trend that may seem counterintuitive actually is occurring.
I begin by surveying the various measures of segregation, as well as the various groups and geographic units to which they may be applied. For the most part, I use the index of dissimilarity with respect to blacks and whites, for census tracts nested within metropolitan areas. Next, I summarize the changes in segregation over time. Black-white segregation has declined sharply since 1970, while levels for Hispanics and Asian Americans have stayed constant (but lower) over this period. I then examine some of the reasons why black-white segregation is falling. Housing discrimination is rarer now, whites are more open to living in diverse neighborhoods, and blacks are migrating to metropolitan areas more conducive to integration. Lastly, I identify some notable caveats. Black-white segregation is still very high in certain areas, it remains sensitive to financial shocks, and socioeconomic separation is rising.
Sociologists have argued for decades over how best to measure segregation. In a well-known 1955 article, Professors Otis Duncan and Beverly Duncan observed that “[t]here have been proposed . . . several alternative indexes of the degree of residential segregation,” all derivable from what they called the “segregation curve.”43 Likewise, in an influential 1988 paper, Professors Massey and Denton identified “20 potential measures of residential segregation.”44 They also claimed that each of these metrics corresponded to one of five distinct dimensions of segregation: evenness, exposure, concentration, centralization, and clustering.45
Fortunately, segregation analysis does not, in fact, require dozens of indices or a fistful of dimensions. It is now reasonably clear that three of Massey and Denton’s dimensions (concentration, centralization, and clustering) collapse into evenness.46 A group that is packed into small areas, or located in the city center, or clustered in a contiguous enclave, necessarily has an uneven spatial distribution.
There also is a good deal of consensus as to how to measure the two remaining dimensions: evenness and exposure. The index of dissimilarity is the most common evenness metric.47 It represents the share of a group’s members who would have to move from one geographic subunit to another in order for the group to be spread uniformly across a broader geographic region.48 A score of 100 percent indicates complete segregation, in that every group member would have to move, while a score of 0 percent means that a group is perfectly integrated. And the index of isolation is the most popular measure of exposure.49 It denotes, for the typical group member, the share of people in her subunit who belong to the same group.50 It too varies from 0 percent (no same-group neighbors) to 100 percent (all same-group neighbors).
Most sociologists further agree that, of the dissimilarity and isolation indices, the former better captures the colloquial meaning of segregation. If, in Massey and Denton’s words, “residential segregation is the degree to which two or more groups live separately from one another,”51 the concept is closer to the evenness of groups’ distributions than to their exposure to one another.52 The other advantage of the dissimilarity index is that it is insensitive to groups’ population shares. Given a particular residential pattern, it does not rise or fall as groups’ numbers change.53 In contrast, the isolation index is tied closely to group size. “Other factors being equal, larger ethnic groups will be more isolated than smaller ones simply because there are more coethnics present with which to share neighborhoods.”54 I therefore focus on the dissimilarity index here, though I also refer occasionally to the isolation index.
Importantly, both of these indices can be calculated for only two groups at a time.55 African Americans are usually one of the two in the work I discuss, both because they have experienced the most severe discrimination of any American racial minority and because more information is available about their residential patterns.56 But I also provide data, when it exists, about Hispanic and Asian American segregation. The second group in most analyses is the non-Hispanic white population. Some studies, though, use all people who do not belong to the racial minority at issue. It is worth noting as well that scholars have begun to develop multigroup variants of the dissimilarity index, such as the entropy index.57 These alternatives are better in theory because they do not treat segregation as a biracial phenomenon,58 and I cite them when possible. Regrettably, they have not been calculated for nearly as many areas or years.
The last methodological choice for indices of segregation is which spatial units to apply them to.59 Both a subunit (such as a census block, block group, or tract) and a broader region (such as a city, metropolitan area, or state) must be selected. Most studies use census tracts as subunits, because they roughly coincide with neighborhoods and are designed to be “as homogeneous as possible with respect to population characteristics, economic status, and living conditions.”60 And metropolitan areas are used most often as broader regions, because they have “a high degree of economic and social integration” and constitute the relevant housing and labor markets for most people.61 Accordingly, the segregation statistics I present below typically are for tracts located in metropolitan areas.62
This background should suffice for present purposes. Next, I summarize trends in segregation for African Americans, Hispanics, and Asian Americans for all periods for which data is available. For the above reasons, I devote the most attention to the index of dissimilarity, calculated for blacks and whites and for tracts in metropolitan areas.
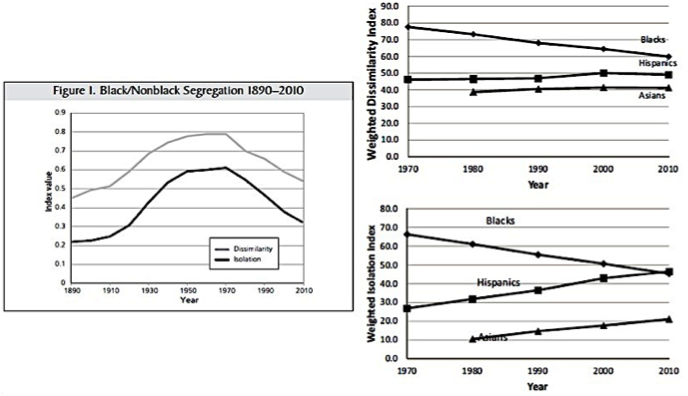
Start with the racial separation undergone by blacks. As described in harrowing detail in American Apartheid—and as shown in Figure 1 below, which is borrowed from a recent study by Professors Edward Glaeser and Jacob Vigdor—it grew steadily from 1890 to 1970.63 The black-nonblack dissimilarity score of the average metropolitan area, weighted by each area’s black population, increased from about 45 percent to about 80 percent during this era.64 Similarly, the average black-nonblack isolation score rose from roughly 20 percent to roughly 60 percent.65 A useful rule of thumb is that segregation scores are high if they are above 60 percent, moderate if between 30 percent and 60 percent, and low if below 30 percent.66 On this scale, the peak dissimilarity experienced by blacks was extraordinarily severe, high enough to warrant labels like “hypersegregation,”67 and the peak isolation was very troubling too.68
Since 1970, though, the situation has changed markedly for the better. Black segregation scores have now fallen for four straight decades, undoing much of the rise that occurred during the twentieth century. According to Glaeser and Vigdor, black-nonblack dissimilarity reached 55 percent in 2010, or about the same level as in 1910, and black-nonblack isolation neared 30 percent, or close to its 1920 threshold.69 Using a similar methodology, Professors John Iceland and Gregory Sharp report nearly identical 2010 black-nonblack dissimilarity and isolation scores.70 Without weighting by black population, and using whites rather than nonblacks as the reference group, Professor William Frey calculates an even lower 2010 black-white dissimilarity score of 47 percent.71 And both weighting and using whites as the reference group, Professor Reynolds Farley,72 Professors John Logan and Brian Stults,73 and Massey and Professor Jacob Rugh74 arrive at black-white dissimilarity scores around 59 percent. No matter how it is computed, then, black segregation no longer qualifies as high for the first time in a hundred years. In fact, as Professor David Cutler, Glaeser, and Vigdor point out, it is about the same as the spatial separation currently experienced by immigrants from Greece, Hungary, Ireland, Italy, and Russia.75
What accounts for this striking improvement? I address underlying causes later, but the arithmetical explanation is twofold. First, within metropolitan areas, blacks increasingly are leaving heavily black neighborhoods and moving to communities with larger white populations—which now are more demographically stable than in the past. The neighborhoods blacks are exiting are largely inner-city ghettos. Detroit and Chicago’s South and West Sides, for example, each lost close to two hundred thousand black residents from 2000 to 2010.76 The communities blacks are entering tend to be suburbs that formerly were mostly white but now are multiracial.77 But there also are numerous cases of urban neighborhoods, like Chicago’s Uptown, New York City’s Jackson Heights, and Oakland’s Fruitvale, developing impressive diversity.78 And the stability of newly integrated communities has increased over time, though they still are more prone to demographic transition than racially homogeneous neighborhoods.79
Second, across metropolitan areas, blacks are migrating in large numbers from the Midwest and Northeast (where segregation levels are higher) to the South and West (where they are lower). The proportion of the country’s blacks living in the Midwest and Northeast fell from 50 percent in 1970 to 38 percent in 2005–2009.80 Over the same period, the South’s share rose from 41 percent to 52 percent as millions of blacks streamed to metropolitan areas like Atlanta, Charlotte, and Dallas.81 This reversal of the earlier Great Migration is responsible for up to one-fifth of the overall decline in segregation since 1970.82
Also interestingly, desegregation is not taking place because of gentrification, at least not to any significant extent. Predominantly black neighborhoods are very stable, in that they are more than 80 percent likely to remain predominantly black from one census to the next.83 These communities also are very unattractive to whites. Only about 2 percent of them achieve a substantial level of black-white integration over the course of a decade.84 True, there are several high-profile exceptions, like New York City’s Bushwick, Philadelphia’s University City, and Washington, DC’s U Street Corridor.85 But for the most part, gentrification is a trend of modest bite, “occurr[ing] primarily at the fringe of the ghetto.”86
Turning next to Hispanic and Asian American segregation, reliable figures are available for only the last few decades. The census did not ask about Hispanic status before 1970, and the Asian American population was too small prior to 1980 for its distribution to be analyzed accurately.87 During the period for which data exists, the situation has been essentially static. Hispanic dissimilarity has hovered around 50 percent and Asian American dissimilarity around 40 percent—both squarely in the moderate zone.88 Figure 1 illustrates this point with a chart from a recent study by Rugh and Massey using whites as the reference group.89 Farley,90 Iceland and Sharp,91 and Logan and Stults92 reach virtually identical results using whites or nonminorities as the reference groups. Figure 1 also shows that the isolation of Hispanics and Asian Americans has increased since 1980.93 The reason, of course, is the remarkable growth of these groups’ populations, which necessarily exposes their members to more of their racial peers.94
But the placid surface of Hispanic and Asian American segregation hides some turbulence beneath. Hispanics and Asian Americans who were born in the United States have dissimilarity scores about 12 percentage points and 8 percentage points lower, respectively, than their foreign-born compatriots.95 Foreign-born Hispanics and Asian Americans also become steadily more integrated the longer they remain in the country.96 The stationary top-line statistics thus reflect two opposing forces fighting to a draw: on the one hand, surging immigration with its segregative impact, and on the other, the ongoing assimilation of longer-term residents.97
The top-line figures for black segregation also are the product of several different forces. Justice Potter Stewart once deemed these causes “unknown and perhaps unknowable.”98 But as I explain below, sociologists actually have learned a good deal about the drivers of racial separation. Because I am most interested in the decline in black segregation since 1970, I stress factors that themselves have shifted over time.
Figure 1. Trends in Segregation99
Discrimination by public or private parties is one obvious explanation for segregation. If the government tries to confine minorities to certain areas—by reserving neighborhoods for different racial groups, refusing to provide mortgage assistance to mixed communities, restricting public housing to inner cities, and so on100 —it is unsurprising that segregated residential patterns arise. Likewise, racial separation follows naturally from private actions such as landlords declining to rent to minorities, realtors steering customers on racial grounds, and threats of violence against minorities who dare to cross the color line.101 As American Apartheid vividly depicts, all of these practices (and more) were used for generations to create and maintain black segregation.102
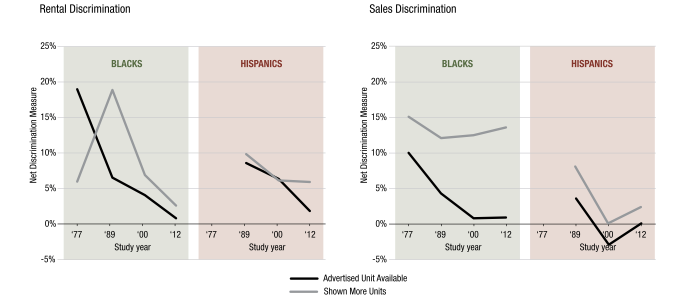
However, housing discrimination has been illegal since the FHA’s passage in 1968, and two kinds of evidence show that its prevalence has, in fact, decreased. First, HUD has conducted four nationwide paired-test studies, initially in 1977 and most recently in 2012.103 These studies rely on paired testers, matched in all respects except for race, to determine how often discrimination occurs.104 The idea is that if the minority tester is treated differently despite being as qualified as the nonminority tester, race must account for the disparity.105 As the graphs reproduced in Figure 2 reveal, both rental and sales discrimination, against both blacks and Hispanics, have declined since 1977.106 Blacks are now almost as likely as whites to be told that advertised properties are available (compared to differences as high as 20 percentage points for rental units in 1977).107 The probability that blacks will be shown fewer properties than whites also has fallen to less than 5 percent for rental units (from a 1989 high of almost 20 percent).108 The figures for Hispanics reflect similar improvement, albeit from lower peaks.109
Second, sociologists have investigated whether blacks pay more than whites for equivalent housing within a metropolitan area. If they do, it may be because their residential choices are constrained by public or private discrimination. In the absence of the discrimination, they presumably would move to more affordable neighborhoods. According to work by Cutler and his coauthors, the black housing premium was substantial in 1940, suggesting “collective action racism on the part of whites.”110 But by 1970 the premium had dropped by about 75 percent, and by 1990 it actually had switched signs, indicating that blacks paid less than whites for comparable accommodation.111 Other scholars report similar results; as Professor Stephen Ross notes, “not a single study has found evidence that African American[s] paid more for housing during the 1980’s or 1990’s.”112
Moreover, not only is housing discrimination falling, but its decline has been linked causally to lower segregation. Professor George Galster used the HUD paired-test data to measure the incidence of discriminatory practices in different metropolitan areas, as well as black-white dissimilarity scores to assess segregation.113 He found that discrimination is a powerful determinant of racial separation. “If we could somehow eliminate discrimination in both rental and sales sectors . . . we would predict . . . a 25-point (50 percent) decrease in the index of segregation within the black community.”114 This is a large effect, and it helps explain why discrimination and segregation have decreased in tandem over the last few decades.115
An alternative account of segregation attributes it to racial groups’ divergent residential preferences. Professor Thomas Schelling popularized this explanation in a famous 1971 paper.116 He explained how almost complete racial separation could arise even if there were no discrimination and most whites and blacks were willing to live in integrated neighborhoods.117 The crux of the problem is that whites and blacks often mean different things by integration. Whites may be willing to tolerate communities up to, say, 20 percent black, while blacks may prefer areas that are, say, 50 percent black.118 In this scenario, blacks will continue entering a neighborhood until it is evenly split. But whites will exit when the black population hits 20 percent, thus producing segregation despite both groups’ wishes to the contrary.119
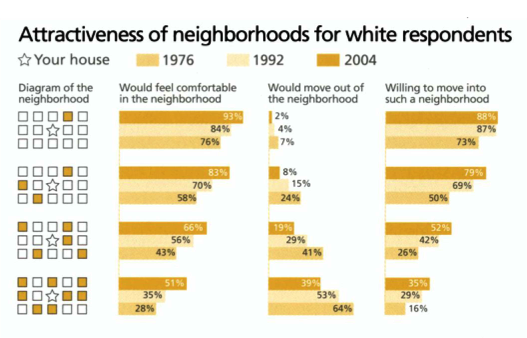
The extent of racial separation in Schelling’s model is highly sensitive to whites’ preferences.120 And on this front too, the trends are encouraging. Farley carried out surveys of white Detroit-area residents in 1976, 1992, and 2004, each time asking about their views of neighborhoods in which one to seven out of fifteen homes are owned by blacks.121 As the graphs reproduced in Figure 2 display, all of the change in this period favored integration.122 For instance, with respect to a community that is one-fifth black, 83 percent of whites said they would feel comfortable living there in 2004 (versus 58 percent in 1976), and 8 percent said they would leave the area (versus 24 percent).123 Nationwide polls asking whether whites would sell their homes if blacks came to live “next door” or “in great numbers in your neighborhood” point to similar progress.124 By the late 1990s, almost no whites said they would sell if blacks moved in next door (versus nearly 40 percent in 1965), and about 30 percent said they would sell if faced with great numbers of blacks (versus about 70 percent).125
Of course, survey results can be criticized on the ground that respondents are reluctant to admit to racist preferences. But Cutler and his coauthors find that self-professed views are tied to actual segregation levels.126 Black-white dissimilarity scores are higher in metropolitan areas where more whites believe that “[w]hite people have a right to keep blacks out of their neighborhoods” and oppose “living in a neighborhood where half of your neighbors [are] black.”127 Also persuasively, Professors David Card, Alexandre Mas, and Jesse Rothstein calculate “tipping points”—the black population shares above which whites exit neighborhoods en masse—for several metropolitan areas over time.128 In Midwestern cities like Chicago and Detroit, tipping points increased from almost 0 percent in 1940 to roughly 10 percent in 1990.129 Nationwide, they rose from about 9 percent in the 1970s to about 14 percent in the 1990s.130 People’s answers to polls, it seems, are not just cheap talk.
That people’s answers are improving, though, leaves open the question of why this shift is occurring. Part of the story surely is a society-wide decline in antiblack racism.131 But as Logan and Professor Charles Zhang show, another piece is the growth of Hispanic and Asian American immigration—and the accompanying rise in the number of neighborhoods with sizable white, black, Hispanic, and Asian American contingents.132 These multiracial communities are quite stable, enduring into the next decade about 75 percent of the time.133 Both whites and blacks also are willing to move into them, in contrast to most other neighborhood types.134 And the more whites and blacks that entered them from 1980 to 2000, the more metropolitan areas’ black-white dissimilarity scores fell.135 These findings suggest that whites are now more willing to live with blacks, at least in part, because they do not have to live only with blacks. Hispanics and Asian Americans increasingly serve as buffers that convince whites not to leave communities with substantial black populations.136
A final set of causes of segregation involves metropolitan areas’ characteristics.137 Studies by several scholars conclude that residential patterns, to some degree, are a function of areas’ demographics, housing stock, and policies. In particular: Total metropolitan area population is linked to higher segregation.138 Areas where more residents belong to the military tend to be less segregated.139 Areas where more housing has been constructed in the previous decade also usually exhibit less racial separation.140 And the more permissive an area’s zoning regime (measured by the weighted average of the development densities allowed by each of the jurisdictions within it), the lower the area’s segregation.141
These factors have contributed to the decline in black segregation because they favor the southern and western metropolitan areas to which blacks have been migrating.142 Iceland, Sharp, and Professor Jeffrey Timberlake observe that southern and western areas have fewer total residents, larger military populations, and newer housing stock than their midwestern and northeastern peers.143 Similarly, Jonathan Rothwell notes that “[w]ith respect to density regulation, the west is the most liberal, followed by the south, and both are significantly more liberal than the Midwest and north-east.”144 As blacks move from areas whose attributes worsen segregation to areas with more favorable profiles, less racial separation is the predictable result.
On balance, my reading of the relevant literature is therefore optimistic. By any metric, black segregation has fallen sharply since 1970, and this decrease is backed fully by positive trends in the forces that drive racial separation. What is more, there is no reason why this progress should halt in the future. As Iceland writes, “multiple forms of assimilation . . . [should] largely reduce the significance of various color lines in metropolitan America.”145 However, it is important not to paint too rosy a picture. As I next discuss, American residential patterns remain troubling in several respects. These problems do not contradict the account I have given so far, but they do cast a considerable shadow.
Figure 2. Causes of Segregation146
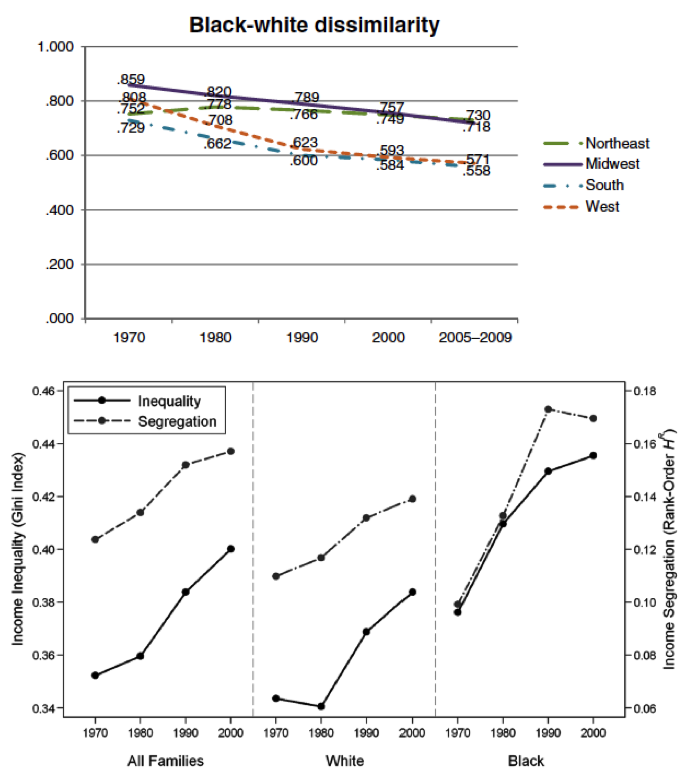
The most critical caveat is that black segregation is still severe in numerous metropolitan areas, especially in the Midwest and Northeast. According to the 2010 census, more than 70 percent of blacks would have to switch neighborhoods to achieve an even black-white distribution in Chicago, Cleveland, Detroit, Miami, Milwaukee, Newark, New York City, Philadelphia, and St. Louis.147 Another twelve areas have black-white dissimilarity scores above 60 percent (and so in the high zone).148 The scores in these areas also are not improving as quickly as in the rest of the country. As shown in Figure 3, which is taken from a study by Iceland and his coauthors,149 black-white dissimilarity declined at a markedly lower rate from 1970 to 2007 in the Midwest and Northeast than in the South and West. These statistics mean that far too many blacks continue to be trapped in highly segregated communities rife with poverty and crime.150
A related point is that the gains in black integration are fragile; they may be reversed, or at least slowed, by economic setbacks. During the financial crisis of the late 2000s, for example, foreclosure rates were almost four times as high in racially mixed neighborhoods (8.6 percent) as in heavily white ones (2.3 percent).151 Many whites in mixed communities responded to the housing market’s deterioration by moving to more homogeneously white areas. As Professor Matthew Hall and his coauthors find, the white population share in mixed neighborhoods dropped by about 0.3 percentage points from 2000 to 2010 for every one-point increase in the local foreclosure rate.152 A consequence of this white exit was a rise of about 1 percentage point in the black-white dissimilarity index.153 That is, black segregation would have fallen by roughly 1 percentage point more over the decade had the financial crisis not struck.154
Another proviso has to do with the geographic level at which integration is occurring. Blacks and whites living in tracts within center cities and suburbs now are substantially less separated than they were in earlier periods.155 But black-white segregation between center cities and their surrounding suburbs, and from one suburb to another, has stayed roughly constant.156 The main driver of the country’s desegregative trend thus is greater black-white intermingling within individual municipalities. Racial separation at the inter- (as opposed to intra-) municipality level has not declined noticeably.
Still another red flag is (largely) nonracial. Segregation along socioeconomic lines, such as income, education, and profession, has surged since 1970. Recent work by Professors Sean Reardon and Kendra Bischoff, which also is displayed in Figure 3,157 makes this point with respect to income. The rank-order entropy index, which measures the extent to which tracts’ income distributions diverge from that of the metropolitan area as a whole,158 increased from about 12 percent in 1970 to about 16 percent in 2000.159 This rise was propelled by growing income inequality,160 and it was the wealthy who were most segregated from other income groups throughout this period.161 Massey and his coauthors come to similar conclusions for education and profession. The dissimilarity index between high school and college graduates increased from roughly 20 percent in 1970 to roughly 35 percent in 2000.162 Dissimilarity between blue- and white-collar workers also rose from about 12 percent in 1971 to about 17 percent in 1997.163
And there are two reasons why race is implicated here, too. First, as Professor Rachel Dwyer shows, the rich and the poor are more likely to be spatially separated in metropolitan areas that have larger black populations and higher black-white dissimilarity scores.164 Black segregation appears to fuel income segregation. Second, as Figure 3 further illustrates, income segregation within the black population is now higher, and has increased at a faster rate, than intrawhite income segregation.165 This development may be attributable to the movement of middle- and upper-income blacks to suburban areas, away from the poorer blacks remaining in inner cities.166 Whatever its cause, the rise in intrablack income segregation means that the rise in overall income segregation is not due to growing income inequality alone. Race, as ever, continues to be part of the story.
A final caveat is that while black-white separation is decreasing, no comparable progress is being made in many other areas. The black-white gap in median household income has remained roughly constant over the last fifty years.167 So has the black-white difference in life expectancy.168 The gulf between black and white incarceration rates has grown substantially since 1960.169 And as I have found in earlier work, blacks remain politically powerless relative to whites, at both the federal and state levels.170 These statistics are highly troubling and call for both academic analysis and policy change. But they are not the subject of this Article, which is limited to housing patterns and their consequences.
Figure 3. Caveats about Segregation171
The above discussion was so detailed because the phenomenon it described is so surprising to many legal observers. Given America’s fraught racial history, black desegregation is not a trend that can be asserted without extensive documentation. From this point forward, though, I take as a given the decline in black-white separation, and turn my attention from sociology to law. My goal is to explore the implications of rising integration for the three civil rights domains most closely linked to racial groups’ residential patterns: the Fair Housing Act, the Voting Rights Act, and school desegregation law. For each area, I show how it historically has depended on the existence of segregation, how it is unsettled by desegregation, and how it might be reconsidered in a less racially separated society.
Two more points before continuing: First, it is true that other civil rights statutes are related to residential patterns too. The Community Reinvestment Act of 1977172 aims to prevent “redlining,” or discrimination in mortgage lending against minority-heavy areas.173 Title VI of the Civil Rights Act of 1964174 imposes on school districts receiving federal funds some of the same obligations created by the Constitution.175 Title VII employment discrimination cases often consider how companies’ applicant pools are shaped by racial segregation in the region.176 And so forth. In my judgment, though, these ties are not as significant as the ones of the areas I address. These areas also seem like more than enough ground for a single article to cover.
Second, because the legal literature has neither traced the links between civil rights law and segregation nor noticed the trend toward desegregation, I rely primarily on court decisions below. These decisions, by the Supreme Court as well as lower tribunals, dramatize how closely the doctrine is connected to racial groups’ residential patterns. They illustrate the many ways in which segregation traditionally has assisted plaintiffs—and in which integration increasingly benefits defendants. Of course, the decisions I highlight are not chosen at random. But even though they are not a representative sample, they still demonstrate that race and place are crucial building blocks of the civil rights edifice.
The Fair Housing Act is the logical law with which to begin. Residential segregation and integration are, at their core, properties of people’s housing, and it is the FHA that deals most directly with the racial aspects of the housing market. In this Part, I first identify the various ways in which segregation historically has facilitated the imposition of liability and aggressive remedies under the FHA. It has given rise to standing; supported findings of disparate treatment, disparate impact, and failure to further integration affirmatively; and justified far-reaching remedial measures.
Next, I argue that all of these pillars of FHA doctrine are shaken by desegregation. Standing is harder to establish in stably integrated areas. Actors in these areas also often cannot be held liable on any theory, whether based on intent, effect, or effort. And potent remedies are both less necessary and more likely to be deemed unlawful. Lastly, I offer a sketch of how the FHA might operate in a more integrated future environment. The statute’s desegregative components might go into a kind of remission, remaining available in theory but seldom being used successfully in practice. But its antidiscrimination177 provisions would remain (almost) as vital as ever.
The FHA prohibits an array of housing-related actions from being taken “because of race [or] color.”178 Among other things, parties cannot “refuse to sell or rent,”179 “discriminate . . . in the terms, conditions, or privileges of sale or rental,”180 “represent . . . that any dwelling is not available for inspection, sale, or rental,”181 or “otherwise make unavailable or deny[ ] a dwelling”182 on racial grounds. The FHA also announces that “[i]t is the policy of the United States to provide . . . for fair housing throughout the [country],”183 and requires all federal agencies involved in administering the law “affirmatively to further [its] purposes.”184
Like most causes of action, the FHA can be divided into three topics: standing, liability, and remedy. In turn—and as recently confirmed by the Supreme Court185 —liability under the statute can come about in three ways: disparate treatment, disparate impact, and failure to further the law’s purposes affirmatively. As I explain below, the segregated residential patterns that persisted for much of the FHA’s history (and that still persist in several metropolitan areas today) made all of these elements easier to prove. If not quite indispensable, segregation at least was highly conducive to the success of certain plaintiffs’ claims.186
Start with standing to file suit. In a trio of early decisions, the Court held that plaintiffs have standing if they live in areas that are segregated, or threaten to become segregated, because of defendants’ actions. In a 1972 case, the claimants were tenants in a San Francisco apartment complex that was almost all-white due to the landlord’s discrimination against nonwhite applicants.187 The Court agreed that the claimants had been injured by “los[ing] the social benefits of living in an integrated community” and “being ‘stigmatized’ as residents of a ‘white ghetto.’”188 Likewise, in cases from 1979 and 1982, the plaintiffs lived in mixed neighborhoods within the Chicago and Richmond metropolitan areas, respectively, that were segregating due to racial steering by realtors.189 Here too the plaintiffs were harmed because the “transformation of their neighborhood from an integrated to a predominantly Negro community [ ] depriv[ed] them of ‘the social and professional benefits of living in an integrated society.’”190
Importantly, the Court based its conclusion that standing follows from segregation on its understanding of the FHA’s purposes. The Court observed in the 1972 case that the law does not only target “discriminatory housing practices.”191 Rather, it also aims to “replace the ghettos ‘by truly integrated and balanced living patterns,’” as the FHA’s architect, Senator Walter Mondale, put it.192 Other legislative history confirms the statute’s dual goals of antidiscrimination and desegregation. One key congressman stated that the FHA would combat the “blight of segregated housing and the pale of the ghetto.”193 Another commented that the law would help “achieve the aim of an integrated society.”194 These remarks provide context for the Court’s position that plaintiffs in segregated (or segregating) areas suffer a cognizable injury. Even if they are not subjected to discrimination, they are victims of another ill that the FHA seeks to cure.
Next consider theories of liability under the FHA, the first (and most common195 ) of which is invidious intent demonstrated by disparate treatment of similarly situated individuals. Evidence that segregation is high in an area, in part because of a defendant’s actions, does not prove that the defendant had a discriminatory or segregative motive. But as courts often have recognized, it is strong circumstantial support for the proposition. For instance, almost all of Yonkers’s minority residents lived in its southwest quadrant in the 1980s, and its other neighborhoods were almost entirely white.196 This pattern had several causes, one of which was the city’s policy, followed for nearly half a century, of placing essentially all public housing units in the same minority-heavy zone.197 This combination of severe racial separation and a “pattern and practice of confining subsidized housing to Southwest Yonkers” convinced the Second Circuit that the city “had intentionally enhanced racial segregation.”198
Illicit intent was inferred from segregation on even starker facts in a 1980 case involving Parma, a suburb of Cleveland. Parma was “virtually all-white”199 in this era, while “[a]n extreme condition of racial segregation exist[ed] in the Cleveland metropolitan area.”200 Parma maintained its racial homogeneity through “opposition to any form of public or low-income housing,” as well as strict zoning regulations and the “creation of [an] image of racial exclusion” by the town’s political leaders.201 Faced with this evidence, the court concluded, “These actions . . . are evidence of a segregative intent. They had a segregative effect which was not only foreseeable, but actually foreseen.”202
A second FHA theory is disparate impact—and one of the ways it may be shown, in the words of a recent HUD regulation, is that “[a] practice . . . creates, increases, reinforces, or perpetuates segregated housing patterns.”203 The link between racial separation and liability could not be clearer here. Segregation itself, as long as it is partly attributable to the challenged practice, represents a prima facie case of an FHA violation.204 One type of policy that numerous plaintiffs have challenged successfully on this basis is a zoning restriction that prevents low-income developments (which would be attractive to minorities) from being built in a heavily white area.205 For example, Sunnyvale, an almost all-white suburb of Dallas, banned apartments outright and imposed a one-acre requirement for homes in the 1990s.206 These policies caused Sunnyvale’s housing to be unaffordable for most minorities, thus “perpetuat[ing] segregation in a town that is 97 percent white” and breaching the FHA.207
Another practice that frequently has been deemed unlawful because of its segregative effect is the restriction of public housing to minority-heavy neighborhoods.208 If minorities apply to live in the public housing in disproportionate numbers (as is usually the case), then its siting worsens, or at least does not improve, existing segregation. My home city of Chicago aptly illustrates this scenario of public housing placement giving rise to liability. In litigation that spanned decades209 and was memorialized in a well-known book,210 it emerged that “substantially all of the sites for family public housing selected by [the Chicago Housing Authority] . . . were . . . located ‘within the areas known as the Negro Ghetto.’”211 The Supreme Court not only upheld the Seventh Circuit’s holding that the law had been violated, but also sustained its order granting sweeping, metropolitan area–wide relief.212
A third FHA theory is that a federal agency (typically HUD) has failed “affirmatively to further the [statute’s] purposes.”213 Since integration is one of these purposes, liability may follow from persistent segregation that the government has not tried sufficiently to reduce.214 A high-profile case of inadequate desegregative effort arose in the 2000s in the Baltimore metropolitan area, where most blacks live in the city and most whites live in the adjoining county.215 Throughout the 1990s, HUD located public housing units almost exclusively in the city and distributed Section 8 vouchers that also were used primarily within the city limits.216 HUD’s failure to consider regional responses to segregation amounted to a lack of affirmative furtherance of the FHA’s goals.217 As the court concluded, “It is high time that HUD live up to its statutory mandate . . . and thus consider regional approaches to promoting fair housing opportunities.”218
Lastly, with respect to remedies, severe segregation has justified aggressive policy responses by both courts and local governments.219 Bold steps that otherwise might have raised legal hackles have been countenanced as the only way to achieve integration. The courts’ orders that hundreds of public housing units be built in heavily white neighborhoods in Yonkers,220 and that thousands of black families be given Section 8 vouchers in order to move to heavily white Chicago suburbs,221 are good examples of forceful judicial intervention. Both orders were upheld on appeal,222 even though they relied explicitly on race in an era in which such means were disfavored.
At the local government level, probably the most famous case of an unorthodox remedy being imposed (and then sustained) is the New York City Housing Authority’s decision in the 1970s to limit the share of minority residents in a Lower East Side public housing development.223 The Authority worried that, without this occupancy quota, the development would become “a non-white ‘pocket ghetto’” that would induce “white residents to take flight,” thus “leading eventually to non-white ghettoization of the community.”224 The Second Circuit approved the quota, reasoning that the Authority’s “obligation to act affirmatively to achieve integration” outweighed the harm of “prevent[ing] some members of a racial minority from residing in publicly assisted housing.”225 To avoid exceeding the local tipping point, that is, desegregation took priority over antidiscrimination.
Given that integration is one of the FHA’s fundamental goals, it may not be surprising that the statute is intertwined so tightly with racial groups’ residential patterns. The extent of these ties, though, has not been grasped previously. At every stage in an FHA case—standing, liability, and remedy—the existence of segregation makes it markedly easier for certain plaintiffs to satisfy their burdens. More importantly, as I argue next, rising integration has the opposite effects. It causes each FHA element to become considerably more difficult to establish. This thesis already is more than conjecture, as the ensuing cases illustrate. And the problems for FHA claimants posed by desegregation only can be expected to intensify as racial separation continues to decline.
Start again with standing. Just as it is a cognizable injury to live in a neighborhood that is segregated (or segregating) because of a defendant’s actions, a plaintiff who lives in a stably integrated area has not been harmed. She has not been deprived (nor faces any risk of deprivation) of the “social and professional benefits” that come from interracial contact.226 For instance, the northern half of the Upper West Side was one of New York City’s few integrated communities in the 1980s.227 It was just over 60 percent white in this period, a level largely unchanged from earlier decades.228 In litigation challenging a proposed luxury development on FHA grounds, the court therefore held that the plaintiffs lacked standing. “[I]t is clear that plaintiffs have not suffered any loss of associational benefits. Indeed, their opportunities to derive the benefits of living in an integrated neighborhood have increased over the years.”229
Similarly, Cleveland Heights is a Cleveland suburb that (unlike Parma) implemented several policies in the 1970s to promote integration.230 As a result, it remained a “racially integrated community” with a population that was roughly 75 percent white and 25 percent black.231 In a lawsuit alleging racial steering by the town, the trial court ruled that a minority plaintiff who resided in Cleveland Heights did not have standing. “[H]e has not lost any of the social benefits of interracial living in his neighborhood. Hence, he is prevented from establishing standing.”232
Next take the disparate treatment theory of FHA liability. In the same way that segregated residential patterns support an inference of invidious intent, integrated patterns suggest the opposite conclusion. A defendant in an integrated area certainly could aim to discriminate or to segregate—but these motives are both less likely and harder to prove in the absence of racial separation. A recent case from Joliet, a suburb of Chicago, highlights the obstacles that integration presents for disparate treatment claims. Joliet is a “very diverse city,” about 53 percent white, 28 percent Hispanic, and 16 percent black as of the 2010 census.233 In the mid-2000s, Joliet decided to use its eminent domain power to acquire, and then close, a large low-income development occupied mostly by minorities.234 Because the dislocated tenants were expected to remain in the city, the development’s closure was predicted to improve (or at least not worsen) existing integration.235 The court thus decided that “this circumstantial evidence . . . cannot support the conclusion that Joliet possesses a discriminatory intent.”236
Likewise, University Oaks is a neighborhood of Houston that, in the 1980s, was “highly integrated with [a] minority population estimated at nearly 50% of the residents.”237 The area’s homeowners voted to renew property deeds that contained restrictive racial covenants entered into half a century earlier.238 In an FHA suit brought by the DOJ, the court relied on the “present composition of the community” to hold that the homeowners “had no intent whatsoever to discriminate on the basis of race.”239 The community’s status as an “integrated model community” offset the more negative deductions about intent that followed from the covenants’ extension.240
The impact of integration on the disparate impact theory of FHA liability is even starker. If residential patterns are integrated and likely to remain so, then it is very difficult for segregation to be “create[d], increase[d], reinforce[d], or perpetuate[d].”241 The basic prerequisite for this kind of FHA violation—a practice that maintains or worsens existing segregation—is absent. Recall from earlier that a disparate impact typically is found when a municipality either uses zoning to prevent low-income developments from being built or restricts public housing to minority-heavy areas.242 Neither of these scenarios is plausible in the face of integration.
For example, in a recent case from Fulton County, a suburban region near Atlanta, the plaintiffs challenged the county’s refusal to rezone property where they hoped to construct a low-income development.243 This property was “in a tract with 54% black population” that bordered another tract that was 42 percent black.244 The court denied the claim, reasoning that “[i]n the absence of the [proposed] development the South Fulton County area likely will remain a racially mixed, predominantly African American area, just as it was previously.”245 Similarly, in a case from the 1990s, the plaintiffs complained about the location and volume of public housing in Islip, a suburb of New York City.246 Islip was integrating rapidly in this period, with the share of its black population living in heavily black tracts falling from 91 percent to 69 percent over a decade.247 This integrative trend helped convince the court that “[t]he evidence presented with regard to the Town’s housing policies . . . fail[s] to establish any segregative effect.”248
Lastly, as to remedies, integration reduces both the need for aggressive measures by courts and municipalities and the likelihood that they will be upheld in litigation. The best evidence of reduced need is indirect. There are very few cases in recent years of courts granting relief on the scale of the 1980s Yonkers and Chicago orders, which led to thousands of black families moving to white areas at public expense.249 There also are “virtually no new [public housing quotas] . . . in this period and thus litigation involving such programs has ceased.”250 The only reason for these quotas was to prevent neighborhoods from tipping.251 As the danger of tipping has receded, so has the impetus to adopt these policies.
The legal vulnerability of forceful remedies is illustrated nicely, in the context of a court order, by a Dallas case from the 1990s. Like the Yonkers and Chicago courts, the Dallas court held that the local housing authority had perpetuated segregation by restricting public housing to minority-heavy areas.252 Also like those courts, it then instructed the authority to build thousands of new public housing units in white neighborhoods.253 But on appeal, this order was deemed a violation of the Equal Protection Clause. Because Dallas was desegregating, thanks in part to the “relative success of [the authority] in moving blacks into predominantly white areas via its Section 8 program,” the “district court’s race-conscious site selection criterion” was not “necessary to remedy the effects of past discrimination.”254
Analogously, courts in the 1980s struck down racial occupancy quotas used by public housing developments in Charlottesville, New York City, and Pittsburgh.255 The problem with all of these policies was the same. In areas that were integrating, slowly but surely, there was insufficient evidence that the quotas were necessary to prevent tipping. As the court observed in the Pittsburgh case, the development had remained “located in an integrated section” even as “the percentage of minority occupancy in the [development] had increased.”256 The housing authority thus was unable to prove that “existing integration . . . would be destroyed absent a restriction on the number of minorities permitted to reside in public housing.”257
But while it is clear that integration complicates several aspects of FHA doctrine, two caveats should be noted here. First, integration has little bearing on claims that are based on discrimination rather than segregation. It is perfectly possible for landlords, realtors, housing authorities, and other parties to discriminate in housing transactions even as residential patterns become less racially separated.258 And second, the case for the disruptive effects of integration is stronger in theory than in practice (at least to date). Compared to the many instances in which segregation has facilitated the imposition of liability and potent remedies, the number of suits in which integration has had the opposite consequences remains modest.259
How come? The most likely explanation is that the national decline in segregation is too recent (and too geographically uneven) to have manifested itself fully in the FHA case law. Until not long ago (and to this day in several metropolitan areas), segregation was not low enough to be a hindrance rather than a boon for plaintiffs. Another possibility is that FHA suits are filed at higher rates in segregated areas than in integrated ones.260 Self-selection of this sort could cause the courts’ perception of American residential patterns to diverge from the empirical reality.
But whatever the reason for the relatively low volume of FHA cases grappling with desegregation, the key points here are conceptual and prospective. Desegregation does make it harder for plaintiffs to show standing, to establish liability, and to win sweeping remedies. And these obstacles are likely to loom larger in the future, as the country continues to integrate. Below, I discuss what these points mean for the FHA as a whole. My view is that they may prompt the statute’s reorientation from desegregation to antidiscrimination—and that this shift in focus would be, for the most part, desirable.
I begin on the bright side. If the elements of a cause of action aimed at bringing about “integrated and balanced living patterns”261 are now trickier to prove—because these patterns are now more prevalent—then congratulations are in order for a significant civil rights victory. The growing problems faced by certain FHA plaintiffs are a sign that one of the statute’s key objectives, desegregation, is closer to being achieved. Diminished activity, heading eventually toward dormancy, is exactly what we should want for provisions combating an evil that gradually is fading from the American residential landscape.
This optimism extends to the FHA’s antidiscrimination project. As discussed earlier, discrimination is a major driver of segregation because it can prevent minorities from being able to live in their preferred neighborhoods.262 The available evidence also indicates that discrimination is decreasing, and so helping to propel the decline in segregation.263 Under these conditions, we might expect (and applaud) a lower frequency of, and success rate for, housing discrimination claims. And indeed, this seems to be what is happening. Professor Michael Schill reports that “blatant forms of discrimination are becoming less common” in complaints filed with HUD.264 Likewise, Professor Stacy Seicshnaydre finds that plaintiffs’ odds of winning FHA appeals fell from 100 percent in the 1970s to 47 percent in the 1980s, 13 percent in the 1990s, and only 8 percent in the 2000s.265 This trend could reflect changing judicial attitudes, but it also could signify that the FHA’s other bête noire is becoming rarer too.266
However, there remain reasons for wariness even in light of this encouraging picture. With respect to the FHA’s desegregative side, it would not be impossible for segregation levels to rise in coming years, say if another economic crisis were to destabilize integrating neighborhoods.267 This sort of shock would raise the profile of doctrinal elements linked to segregation and make them easier for plaintiffs to establish.268 In addition, even in a generally integrating society, specific actions may well be taken with segregative intent or have a segregative effect. The law should remain watchful for these actions, not overlooking them due to the overall rise in integration.
The need for vigilance is even greater with respect to the FHA’s antidiscrimination half. Housing discrimination may be declining, and it may no longer be the main determinant of racial groups’ residential patterns, but it still occurs far too often. Notably, the most recent HUD survey concluded that about 9 percent of black renters and 13 percent of black homebuyers are told about fewer available units than their white peers.269 Roughly 3 percent of black renters and 9 percent of black homebuyers also are shown fewer units.270 These rates are substantially lower than in earlier eras, but they still imply that hundreds of thousands of FHA violations take place each year.271 The struggle against discrimination clearly has not yet been won.
This analysis suggests that the FHA may operate somewhat differently in the future than it has to date. Historically, many landmark cases involved desegregation in some capacity. The Supreme Court’s leading encounters with the statute addressed standing in segregated areas and disparate impact claims based on the furtherance of segregation.272 In the lower courts too, “the more common type” of disparate impact decision dealt with “exclusionary zoning . . . challenged on the ground that it perpetuates housing segregation.”273 By contrast, antidiscrimination cases, while abundant, were relatively small-bore.274 They implicated fewer parties, had less dramatic consequences, and did not set off the same judicial fireworks.275
Going forward, though, antidiscrimination is likely to be where the action is. In a more integrated environment, segregation should not be as grave of a concern, and there should not be as much for the FHA’s desegregative provisions to do. These provisions still should have some utility, serving as a prophylactic in case segregation rises again as well as a weapon against lingering segregative practices. But their potency may well be lower than in previous periods. On the other hand, even in an integrating society, housing discrimination probably will persist at levels necessitating substantial litigation. Landlords will continue refusing to rent to minorities, realtors will keep steering homebuyers to different neighborhoods, and so on. The resulting antidiscrimination suits still may be small-bore, at least compared to the earlier battles over desegregation. But odds are they will be, if not the only game in town, at least the most important one.276
On balance, I find appealing this account of how the FHA eventually might function. Less would be asked of the statute, especially in terms of desegregation. But less would be needed, given the ongoing declines in both racial separation and discrimination. Instead of fighting endlessly in the trenches, the law might evolve into a sort of tactical reserve, intervening at times to preserve existing gains and quell new uprisings. This is not a heroic vision, but we are gradually moving toward an America that may not require a heroic FHA.
The next civil rights statute I address is the Voting Rights Act—in particular, its core operative provision, § 2, which bans racial vote dilution.277 The VRA does not have as obvious a relationship as the FHA with racial groups’ residential patterns. Why, after all, should the fate of a vote dilution claim hinge on the segregation of a minority population? The answer cannot be found in the law itself. It lies, instead, in the doctrine the courts have devised to apply the VRA. The Supreme Court has held that there can be liability only if a minority group is geographically compact—that is, segregated. The Court also has required proof of racial polarization in voting.278 Polarization is conceptually distinct from segregation, but as a methodological matter, it is easier to show under segregated conditions. And for their part, the lower courts have added racial separation to the list of factors that may be considered at the totality-of-circumstances stage of the analysis.279
As in the FHA case, integration interferes with all of these elements. By definition, an integrated minority group is not geographically compact, and so cannot prevail in a VRA challenge. Polarization also may exist in an integrated area, but the techniques typically used to estimate it are unreliable in this setting. At the totality stage, too, integration weighs against a finding of liability. But unlike in the FHA case, these implications are cause for concern, not contentment. One of the VRA’s goals is minority representation, and this aim is directly threatened by desegregation. Fortunately, the danger here is doctrinal rather than statutory, and so could be dispelled by judicial rather than legislative action. To enable the VRA to play its proper role, the courts could eliminate the compactness requirement, permit polarization to be shown using new methods, and authorize remedies other than single-member districts.
Enacted in 1965 and substantially amended in 1982, § 2 of the VRA now prohibits what is known as racial vote dilution: state action, short of outright disenfranchisement, that makes it more difficult for minority voters to elect their preferred candidates.280 Specifically, the provision forbids any “practice[ ] or procedure . . . which results in a[n] . . . abridgement of the right . . . to vote on account of race or color.”281 “A violation . . . is established if, based on the totality of circumstances, it is shown that . . . members of a [minority group] have less opportunity than other members of the electorate . . . to elect representatives of their choice.”282 Section 2 also states that “[t]he extent to which members of a protected class have been elected to office . . . is one circumstance which may be considered.”283
A careful reader may notice that the statutory text does not mention compactness, polarization, or racial separation. This observation is accurate. These concepts are part of § 2 law not because they are recognized by the provision itself, but rather because courts have inserted them into the doctrine. This insertion occurred most famously in the Supreme Court’s 1986 decision, Thornburg v Gingles,284 its first construal of the amended statute.285 The Court held that there are three “necessary preconditions” for liability in vote dilution suits.286 First, “the minority group must be . . . sufficiently large and geographically compact to constitute a majority in a single-member district.”287 Second, the group must be “politically cohesive.”288 And third, “the white majority [must] vote[ ] sufficiently as a bloc to enable it . . . usually to defeat the minority’s preferred candidate.”289 If these criteria are met, the final analytical step is a totality-of-circumstances inquiry focused on the nine factors identified by the Senate report that accompanied § 2’s revision in 1982.290
Of these elements, the one that is linked most directly to racial groups’ residential patterns is Gingles’s first prong, geographic compactness. To require a group to be geographically compact before liability may be imposed, in essence, is to require it to be residentially segregated. That the Court conceived of compactness and segregation as largely synonymous is clear from its decision. At various points, it referred to the minority voters who would be able to win vote dilution claims as “geographically insular”291 and “sufficiently concentrated.”292 It also contrasted these voters with ones “spread evenly throughout a multimember district” and “substantially integrated throughout the jurisdiction,” who would not be able to prevail.293 Commentators have pointed out the convergence between compactness and segregation as well. In Dana Carstarphen’s words, “the Court has made residential segregation a prerequisite to the protection of rights established by the Voting Rights Act.”294
Why did the Court predicate § 2 liability on something as seemingly unrelated as segregation? The explanation lies in the only remedy the Court contemplated for violations of the provision: the creation of single-member districts. If a minority group is segregated, a district easily can be drawn around it, and the group then can elect its preferred candidate as long as Gingles’s other criteria (sufficient size and racial polarization) are met.295 Conversely, if a group is residentially integrated, it becomes very difficult for a district to capture enough of its members to enable them to elect the candidate of their choice. To do so (where it is possible at all), a district must assume a highly irregular shape, connecting whatever local concentrations of the group happen to occur. As the Court put it, if a group is not segregated, “as would be the case in a substantially integrated [area],” then district lines “cannot be responsible for minority voters’ inability to elect [their preferred] candidates.”296
Importantly, the Court was correct that segregation can increase minority representation if single-member districts are used.297 Two recent studies examine how a state’s index of dissimilarity (calculated for minorities and nonminorities, and for counties within the state) is related to its number of congressional majority-minority districts.298 Both studies find that, even controlling for minority population size, partisan control, and redistricting criteria, more segregated states tend to have more majority-minority districts.299 In fact, as the dissimilarity index varies from its lowest to its highest level, states form over two times more districts in which minorities can elect the candidate of their choice.300 These results confirm that a compactness requirement is reasonable as long as § 2 remedies are restricted to single-member districts.
Turning next to Gingles’s second and third prongs,301 they are tied methodologically rather than substantively to segregation. Minority political cohesion (the second prong) and white bloc voting (the third one) boil down to a single concept: racial polarization in voting.302 If most minorities support one candidate, and most whites back her opponent, then voting is racially polarized (and vice versa). Polarization, in turn, has no inherent connection to segregation.303 Racial groups can prefer different candidates while living near one another, or the same candidate while living apart.304 But both of the techniques typically used to measure polarization rely on segregated residential patterns. Segregation is what makes these techniques feasible.
The simpler method to calculate polarization is homogeneous precinct analysis.305 First, election precincts that are highly (usually over 90 percent) racially homogeneous are identified.306 Second, the results of elections involving a minority candidate of choice are compiled for these precincts. And third, these results are used to determine the extent of minority political cohesion and white bloc voting.307 As should be obvious, all of these steps hinge on the presence of racially homogeneous precincts—that is, segregation.308 Only if there exist precincts at least 90 percent of whose voters belong to the same race can the analysis begin. As Professor Bernard Grofman, Dr. Lisa Handley, and Professor Richard G. Niemi comment, “if there are precincts that are overwhelmingly (say, 90 or 95 percent) composed of members of the same race, one can be extremely confident of the voting behavior of members of that group.”309
The more advanced approach to estimating polarization is ecological regression (of which there exist still more sophisticated variants, such as Professor Gary King’s ecological inference).310 All precincts, not only racially homogeneous ones, are used by this technique. The share of the vote received by the minority-preferred candidate in each precinct then is regressed on each precinct’s minority population share. The fit of this regression indicates how well electoral preferences are explained by race, while the 0 percent and 100 percent intercepts denote the levels of minority political cohesion and white bloc voting.
Again, this procedure works best when most voters in most precincts belong to the same race. Under these conditions, impossible conclusions (for instance, that 110 percent of black voters support the black candidate of choice) are rare.311 The impact of the ecological fallacy, which points out that individuals’ preferences cannot be ascertained using group-level data, is reduced too.312 The procedure also is most tenable when voters belong to either of precisely two races. Then the proportions that are inputted into the model do not hide the presence of other racial groups, and valuable information about voting and demography is not sacrificed.313 Ecological regression thus depends on not only a segregated society, but also a biracial one.314
Lastly, recall that Gingles’s final step is a totality-of-circumstances inquiry in which the nine Senate factors take center stage.315 Racial separation is not one of these factors, but numerous lower courts nevertheless have added it to the list of items that should be considered.316 For example, one court observed that South Carolina’s “Charleston County remains to a large extent separated along racial lines.”317 The area’s segregation weighed in favor of § 2 liability because it “hinder[ed] the ability of African–American candidates to solicit the votes of white voters.”318 Similarly, another court noted the high black-white dissimilarity index of Euclid, Ohio.319 Here too, “racial separation in Euclid’s housing . . . serve[d] to hamper the ability of African–American candidates to fully engage the predominately white electorate.”320
To be sure, not all of § 2 revolves around segregation. Gingles’s first prong also implicates the size of the minority population and the shape of the district that could be drawn around it.321 As a substantive matter, the second and third prongs involve racial groups’ electoral preferences, not their residential patterns.322 And the nine Senate factors do not even refer to racial separation (though they do emphasize one of its key causes, discrimination).323 Still, it seems undeniable that segregation plays a substantial (if not exclusive) role at each § 2 stage. Next, I show how these functions are compromised by rising integration. Both in theory and in practice, integrated minority groups face serious obstacles in winning vote dilution challenges.
The problems posed by integration are clearest with respect to Gingles’s first prong. Minority voters who are residentially integrated are the very opposite of a geographically compact group. In the Court’s terminology, they are diffuse rather than “insular,” dilute rather than “concentrated.”324 Accordingly, they cannot prevail under § 2, because they fail one of the Court’s “necessary preconditions” for liability.325 As Professor Richard Briffault puts it, “Where minorities are residentially scattered . . . it [is] difficult to create [the] majority-minority districts” assumed by Gingles to be the only available remedy for vote dilution.326
The Court confronted “largely integrated communities” of Houston-area blacks and Hispanics in an important 1996 case.327 The plaintiffs argued that § 2 required “two of the three least regular districts in the country” to be constructed, one with a black majority and the other with a Hispanic majority.328 A plurality rejected this claim, declaring, “If, because of the dispersion of the minority population, a reasonably compact majority-minority district cannot be created, § 2 does not require a majority-minority district.”329 In the lower courts, a notable case of an integrated group failing to satisfy Gingles’s first prong arose in Louisiana in the 1980s. Blacks in Jefferson Parish were “dispersed widely” with small black clusters scattered throughout the region.330 The only district that could enclose a black majority “contain[ed] no less than 35 sides” and crossed the “major natural boundary” of the Mississippi River.331 The court therefore held that the black population was not “sufficiently compact” and that the plaintiffs’ proposed district was not “an acceptable remedy to the vote dilution.”332
Moreover, not only are integrated minority voters unable to comply with Gingles’s first prong, but if a district nevertheless is drawn around them, it is likely to be unconstitutional. Under the Court’s racial gerrymandering doctrine, a district is unlawful if “race was the predominant factor motivating” the district’s formation.333 Race often has been found to be the predominant motive when scattered minority voters were corralled within the same odd-looking district. For instance, the Court invalidated the Houston-area districts noted above, in part because they “connect[ed] dispersed minority population[s]” and “capture[d] pockets of Hispanic residents.”334 Similarly, in another landmark 1996 case,335 the Court struck down an elongated North Carolina district that enclosed the “relatively dispersed” black population in the state’s center.336 In the Court’s view, a district including “individuals who belong to the same race, but who are otherwise widely separated by geographical . . . boundaries . . . bears an uncomfortable resemblance to political apartheid.”337
Next, with respect to Gingles’s second and third prongs, integration presents technical rather than substantive hurdles. If there are few racially homogeneous precincts in an area, analyses requiring such precincts can be conducted only with difficulty. Reliable inferences about racial groups’ electoral preferences cannot be drawn from precincts with diverse populations.338 Likewise, ecological regression is less accurate when minorities and whites live in more integrated patterns. The confidence bounds of the method’s estimates increase, impossible results are more common, and the impact of contestable assumptions grows.339 As Professor James Greiner explains, “current circumstances, particularly an increasingly melting-pot United States polity, now challenge these techniques [for measuring polarization] in new ways.”340
These concerns are not merely academic. In a 1980s case from California, there was a “dispersion of [H]ispanics and blacks throughout the City of Pomona.”341 As a result, the court rejected the plaintiffs’ estimates of minority political cohesion and white bloc voting. “Their homogenous precincts analysis is inappropriate because, due to the dispersion of minorities . . . there are no homogenous precincts that are 90 to 100% of one race.”342 Similarly, in a recent case from Alabama, Hispanics and Native Americans were substantially integrated throughout the state. Here too, the court declined to credit the plaintiffs’ allegations about polarization because there was “an insufficient concentration of Native Americans or Hispanics . . . for ecological regression analysis.”343
Lastly, just as the presence of racial separation may weigh in favor of liability at the totality-of-circumstances stage, its absence may point in the opposite direction. In a striking 2000s case from Colorado, the court found that all of the Gingles factors likely were satisfied.344 The court nevertheless upheld the at-large election of Alamosa County’s commissioners, in part because of the “extensive integration and association among Hispanic and Anglo residents.”345 The court observed that “Hispanic residents now live, work, and own businesses both north and south of the [old] demarcation line,” and that “Hispanic residents . . . are not as geographically and socially isolated.”346 This intermingling precluded § 2 liability, according to the court, because it showed that racial discrimination was no longer prevalent in the county.347
As with the FHA, these examples of § 2 claims being undercut by integration are rarer than the reverse scenario—namely, § 2 claims being bolstered by segregation.348 As before, the relative dearth of the former cases probably is attributable to the recency of America’s desegregative trend, as well as strategic decisions by plaintiffs to file suit in areas that remain segregated.349 And again, the key points for present purposes are that integration does complicate each § 2 element, and that these problems are likely to worsen as the country desegregates further. Below, I discuss the operation of § 2 under more integrated conditions. I explain how the doctrine construing the provision could be amended to allow it to continue promoting minority representation.
I was mostly sanguine earlier about the FHA’s future role for one simple reason: The statute aims to bring about “integrated and balanced living patterns.”350 Since housing segregation has been falling and probably will keep falling, the law is progressing toward the achievement of one of its core objectives. Unfortunately, such optimism is not in order for § 2. Residential integration is not one of § 2’s goals. But minority representation is one of them, and for all of the reasons discussed above, it is imperiled by desegregation. Lawsuits making possible the election of minority-preferred candidates become ever harder to win as minority voters grow ever more dispersed.
That § 2 seeks (among other things) to improve minority representation is clear from the statutory text itself. The provision emphasizes minority voters’ “opportunity . . . to elect representatives of their choice.”351 It also provides that the “extent to which members of a protected class have been elected to office . . . is one circumstance which may be considered.”352 The legislative history confirms this purpose. One of the Senate factors that courts evaluate at Gingles’s totality-of-circumstances stage is the “extent to which members of the minority group have been elected to public office.”353 The 1982 Senate report notes as well that “the presence of minority elected officials is a recognized indicator of access to the process.”354
It is true that minority representation is not § 2’s only goal. The provision also tries to stop cruder practices that hinder minority voters’ access to the polls or disenfranchise them outright.355 It is true as well that minority representation is a controversial objective. Opponents of the 1982 amendments warned that the revisions would require proportionality in the election of minority officials.356 Justice Clarence Thomas famously has decried the whole concept of vote dilution as a “hopeless project” and a “disastrous misadventure.”357 And Justice Anthony Kennedy may believe that § 2 only protects (and can ever compel) “naturally arising” majority-minority districts in minority-heavy areas.358 But these are largely dissenting voices. The prevailing view, at least in most court decisions and among most litigants, is that minority representation is indeed part of § 2’s mission. As Professor Lani Guinier remarks, “The belief that black representation is everything has defined litigation strategy under the Voting Rights Act.”359
How, then, can § 2 continue to secure minority representation in an integrating America? In fact, there are several ways, of varying potency and plausibility. First, and most intuitively, Gingles’s geographic compactness requirement could be eliminated. If minority groups did not have to be compact—that is, segregated—to establish liability, then dispersed groups would be able to prevail in vote dilution suits. Integration would not thwart them at the first step of the Gingles framework. The same point holds for remedies. If courts could order the creation of odd-looking districts containing scattered minority voters, then appropriate relief would be available for integrated plaintiffs. They would be able both to show a violation of § 2 and to cure it.360
Second, and relatedly, the cause of action for racial gerrymandering could be discarded. This theory already has been criticized because it makes the message allegedly conveyed by a district a constitutional offense, even in the absence of any tangible injury.361 The theory has the additional drawback of rendering suspect the irregular districts that are needed to capture dispersed minority voters. These districts can be explained only on racial grounds, but any racial explanation triggers strict scrutiny, which the districts typically cannot survive. Accordingly, if the theory were cast aside, there would no longer be an equal protection threat to constituencies that enable integrated minorities to elect their preferred candidates. These districts would be valid under § 2 and free from their current constitutional shadow.362
Third, plaintiffs could start employing (and courts could start endorsing) additional techniques for measuring polarization. Surveys, in particular, hold enormous promise. Because they ask individuals about their electoral preferences, they avoid the ecological fallacy entirely. Their results are just as accurate whether precincts are racially homogeneous or heterogeneous, or whether there are two racial groups or more.363 The cost of surveys also is decreasing as online polling becomes more prevalent.364 Furthermore, statistical methods have emerged recently that allow public opinion in small geographic units to be calculated using modestly sized samples.365 And as Greiner and Professor Kevin Quinn demonstrate, surveys can be combined with conventional techniques to produce more reliable polarization estimates than either approach alone. “[T]he hybrid is always preferable to the ecological model,” and also “dominates the survey sample estimator.”366
Lastly, and most impactfully, litigants and courts could be more receptive to remedies other than single-member districts. No matter how cleverly they are drawn, it is difficult for such districts to enclose scattered minority voters—and impossible for them to provide representation to small minority groups. In contrast, multimember districts paired with cumulative, limited, or preferential voting face neither of these obstacles.367 They enable integrated minorities as well as minorities too small to constitute a local majority to elect the candidates of their choice.368 As Professor Shaun Bowler and his coauthors find in a notable study, counties using cumulative or limited voting elect higher shares of black commissioners than counties using single-member districts.369 The alternative voting systems are unaffected by the geographic and numerical constraints that apply to traditional districts.
All of these options are appealing because they could be implemented without legislative action. A Congress that cannot agree on a new coverage formula for the VRA’s other core provision, § 5, is highly unlikely to amend § 2 in any significant way.370 However, the first two proposals are only slightly more plausible than congressional intervention. The current Court is no fan of § 2, having frequently limited its reach and raised doubts about its constitutionality.371 The odds thus are low that the Court, at least as presently composed, would scrap Gingles’s compactness requirement or reverse its racial gerrymandering rulings.
This leaves the third and fourth options, both of which could be undertaken without any Court involvement. No Court precedent precludes either the use of surveys to measure polarization or the judicial imposition of alternative remedies. These steps, then, should be the top priorities for plaintiffs and lower courts who would like § 2 to keep promoting minority representation even as residential integration rises. They are the most realistic ways to prevent a key statutory goal from being frustrated by a trend that ought to be irrelevant—but in fact is all too salient at every stage in the analysis.
The final area I cover is constitutional rather than statutory: school desegregation law, which bans the intentional segregation of public schools and requires aggressive remedies to be maintained until all vestiges of the original violation have been eliminated. In this domain, of course, it is school segregation statistics that are crucial, not residential ones. I therefore begin this Part by summarizing the changes in, and causes of, school segregation. Public schools desegregated rapidly between the late 1960s and the late 1980s, and have sustained about the same level of racial separation ever since. The brisk drop was largely the result of judicial intervention, while the recent stasis comes from court orders being lifted while residential desegregation exerts a steady downward influence.
Next, I describe the role that residential segregation historically played in school desegregation litigation. It created conditions in which school district policies could have a segregative effect, from which an inference of segregative intent then could be drawn. It also made it harder for integrative measures to succeed, and so hindered districts’ efforts to attain unitary status. I then argue that residential integration has the opposite doctrinal implications. To the extent it promotes school integration, it weighs against a finding of segregative intent. Also to this extent, it assists school districts seeking unitary status.
Lastly, I comment on the state of school desegregation law as America continues to integrate residentially. On the positive side, there is reason to think that public schools will resume integrating in the near future, even if courts remain mostly somnolent, thanks to the ongoing residential trend. Less sunnily, the impact of this trend on school segregation is likely to be gradual, contingent on other factors, and less potent than judicial intervention. The impact, such as it is, also has no bearing on other racial imbalances in schools, involving faculty assignment, physical facilities, and the like. The need for courts to stay involved in this area—indeed, to become more involved—thus is undiminished.
School segregation is measured in the same way as residential segregation, only using different units. Public schools (rather than census tracts) are the subunits in nearly all studies. School districts and metropolitan areas are the most common broader regions.372 Enrollment data about these entities enable the calculation of both evenness metrics like the index of dissimilarity and exposure metrics like the index of isolation. Here, the dissimilarity index represents the fraction of students who would have to switch schools in order for every school in the district or metropolitan area to have the same racial makeup.373 Similarly, the isolation index indicates, for the typical student of a certain race, the share of students in her school who belong to the same racial group.374 As in the residential context, the dissimilarity index is preferred by most scholars because it is unaffected by group size and better captures the colloquial meaning of segregation.375
In a helpful study, Professors Logan, Deirdre Oakley, and Jacob Stowell compute the black-white dissimilarity index for school districts and metropolitan areas in 1970 (just as court-ordered desegregation began in earnest), 1990, and 2000.376 As shown in a chart reproduced in Figure 4, the score for the average district fell from close to 80 percent in 1970 to just under 50 percent in 1990 and 2000.377 The score for the average metropolitan area declined from about 80 percent in 1970 to roughly 65 percent in 1990 and 2000.378 (Metropolitan area segregation is higher than school district segregation because each area’s districts vary—often starkly—in their racial complexions.) More recently, Kori Stroub and Professor Meredith Richards estimate the entropy index (a more sophisticated variant of the dissimilarity index) at the metropolitan area level from 1993 to 2009.379 As also shown in Figure 4, black-white school segregation decreased slightly over this period.380 The overall picture thus is one of sharp desegregation from the late 1960s to the late 1980s, followed by stability ever since.381
It is worth noting that certain scholars, in particular Professors Erica Frankenberg and Gary Orfield, dispute this account. They claim that American schools actually are resegregating, based on data indicating that the typical black student now has a smaller share of white classmates, and is more likely to attend a heavily minority school, than in the 1980s.382 These shifts, however, are attributable entirely to demographic changes (in particular, Hispanic and Asian immigration and the lower white birth rate), not to the distribution of students across schools.383 As whites become an ever smaller fraction of the student population, it is inevitable that minorities will be exposed to fewer of them.384 (It also is inevitable that whites will be exposed to more minorities, which implies more rather than less integration.385 ) I therefore join Logan and others in concluding that “[i]t is misleading to label these trends as resegregation,” and do not discuss them further.386
Why does the trajectory of school segregation differ from that of residential segregation (which has declined steadily since 1970)? The answer is that residential segregation is just one of the drivers of school segregation. School segregation also is a function of three other sets of factors.387 First, the policies that school districts adopt can have significant integrative or segregative consequences. Measures (often court-imposed) such as adjusting attendance zones, busing students to diverse schools, and opening magnet schools that draw students of all races, can improve integration. On the other hand, neighborhood schools as well as school choice policies such as vouchers and charter schools can worsen racial separation. Second, the configuration of school districts themselves can influence metropolitan area segregation. In particular, the more districts there are in a given area, the more potential there is for segregation to develop between (rather than within) districts. And third, the racial profiles of public schools depend in part on the numbers and identities of students choosing to attend private schools. Public school segregation can be affected by exit from the public system.
Of these factors, I focus here on school district policies adopted either in the wake of litigation or after the attainment of unitary status. These measures have larger impacts on school segregation than do school choice policies or private school enrollment.388 These measures also account nicely for the key features of the post-1960s history of school segregation: a generation of improvement followed by a generation of stagnation.389 And since the Supreme Court has ruled out interdistrict remedies (including district consolidation) in almost all cases, these measures are the only ones that realistically are subject to judicial control.390
Starting with court orders to desegregate, then, they were issued to about 750 school districts, mostly in the South and mostly in the late 1960s and 1970s.391 These orders typically required attendance zone adjustment, busing, magnet schools, majority-to-minority transfers, or other integrative steps.392 Thousands of additional districts took similar actions on their own, often in an effort to avoid litigation.393 In a recent study, Professor Sarah Reber finds that the white-nonwhite dissimilarity index plummeted in school districts that were compelled to desegregate.394 As displayed in Figure 4, segregation fell by about 20 percentage points in the two years after judicial intervention, and then maintained these gains for more than a decade.395 Other studies come to very similar conclusions.396
Next, school districts began attaining unitary status in large numbers in the 1990s and 2000s, after a trio of Supreme Court decisions made release from judicial supervision easier to obtain.397 About two-thirds of districts ever subject to desegregation orders now have been deemed unitary, leaving only about 250 still required to abide by them.398 Most unitary districts eventually abandon their integrative policies and revert to neighborhood schools.399 In a study of all school districts freed from desegregation orders, Professor Reardon and his coauthors show that their black-white dissimilarity index increased moderately during the fifteen years after release.400 Specifically, as illustrated in Figure 4, segregation rose by about 5 percentage points over this period, or roughly one-quarter of the decrease originally attributable to judicial intervention.401 Again, other studies covering fewer districts generate almost the same results.402
These findings about desegregation orders and unitary status, in conjunction with the ongoing decline in residential segregation, explain the trajectory of school segregation over the last half century. Between the late 1960s and the late 1980s, demography and the judiciary operated in tandem. Rising residential integration pushed schools, slowly but surely, in the same integrative direction. Concurrently, court-ordered remedies cut school segregation more sharply than the residential trend ever could. But from the late 1980s to the present, demographic and judicial forces have worked at cross-purposes. On its own, residential integration would have produced further school integration. This positive influence has been neutralized, though, by the unitary status that courts have granted to hundreds of school districts. The outcome of these countervailing pressures has been a draw—stasis where there would have been improvement had the judiciary stayed its hand.403
That so few school districts remain subject to court supervision (about 250 out of roughly 14,000 nationwide404 ) also suggests that residential and school segregation now are tied more tightly than in the past. When courts in an earlier era insisted on sweeping remedies, they decoupled the link between the two forms of segregation. Schools became integrated even as housing patterns stayed racially separated. But now that courts largely have left the stage, and most districts have exploited their departure to return to neighborhood schools, residential segregation should be a stronger predictor of school segregation. The integrative policies that dilute its impact mostly are no more.
This hypothesis turns out to be correct. In a multiple regression model of black-white metropolitan area school segregation, the coefficient for black-white residential segregation jumped from 0.58 in 1970 to 0.94 in 1990.405 The raw correlation between these two indices then increased again from 0.70 in 1990 to 0.83 in 2000.406 And as shown in Figure 4, the correlation between black-white residential segregation (for the under-eighteen population) and black-white school segregation rose once again from 2000 to 2010.407 Residential segregation now accounts for an incredible 91 percent of the variation in school segregation at the metropolitan area level.408
I address the implications of this strengthening bond at the end of this Part. In brief, it means that school segregation should resume declining in the future, even without judicial intervention, as long as residential patterns continue integrating. Below, though, I turn from empirics to doctrine. I first show how residential segregation historically assisted plaintiffs in school desegregation cases, at both the liability and unitary status stages. I then argue that residential integration throws a wrench into this area of law as well.
Figure 4. Trends in, and Causes of, School Segregation409
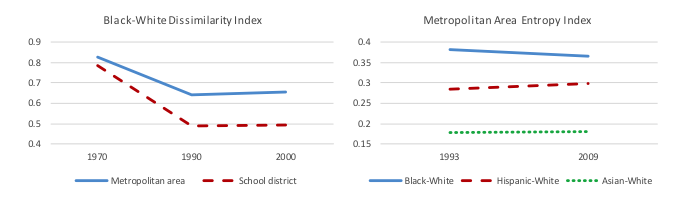
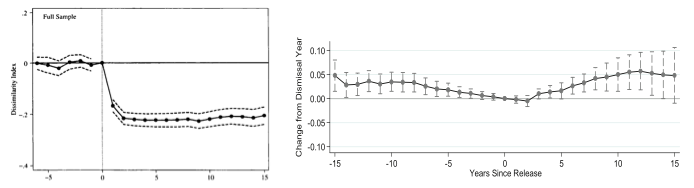
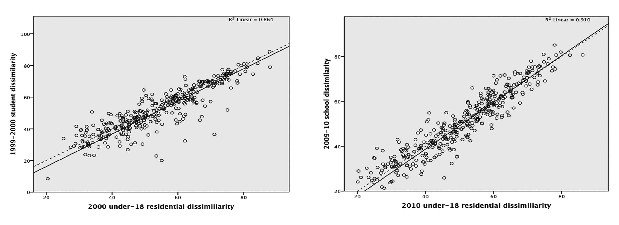
![]()
![]()
A plaintiff’s initial task in a school desegregation case is to establish segregative intent—to prove that a school district deliberately separated students by race.410
The most direct way that residential segregation can support an inference of segregative intent is by helping to produce school segregation, from which an invidious motive then can be deduced. Residential segregation can give rise to school segregation, which in turn can give rise to liability.411
A 1960s case involving the school system of Manhasset, a New York City suburb, illustrates this logical sequence. One of Manhasset’s neighborhoods was over 90 percent black, while the rest of the town was almost entirely white.412 For decades, the school district maintained a “rigid neighborhood school policy”413 that resulted in 99 percent of white students attending all-white schools and all black students attending a school that was 94 percent black.414 “On the facts of this case,” without the district having done anything other than retain its neighborhood school policy, the court found “state imposed segregation.”415
Similarly, Corpus Christi exhibited “substantial residential concentration by ethnic groups” in the 1970s, with blacks and Hispanics “concentrated in a narrow area.”416 Here too, the school district adhered for decades to a “neighborhood school plan composed of geographic attendance zones” that yielded stark school segregation.417 And here too, the Fifth Circuit held that the Constitution was violated. “The Board imposed a neighborhood school plan . . . upon a clear and established pattern of residential segregation in the face of an obvious and inevitable result.”418
However, cases in which liability follows so closely from residential segregation are unusual.419 This is because school segregation alone, even if caused by segregated housing patterns, typically is not enough to make out a constitutional violation. As one treatise puts it, “Statistics demonstrating a racial imbalance in the racial composition of individual schools, by themselves, will probably not be sufficient” “to prove intentional or purposeful segregation.”420 At this stage, then, the more common role of residential segregation is somewhat more indirect. Rather than leading at once to culpability, it creates conditions in which school district policies such as new school construction and attendance zone adjustment can have a segregative effect. Segregative intent then is inferred from a district’s voluntary decision to adopt these policies.
Examples of residential segregation serving this function abound, including in the Supreme Court’s case law. In a 1973 decision, the Court dealt with the school system of Denver, one of whose neighborhoods, Park Hill, was “substantially Negro and segregated.”421 The school district used “various techniques such as the manipulation of student attendance zones, schoolsite selection, and a neighborhood school policy” to keep the Park Hill schools heavily black and the schools in adjoining areas heavily white.422 In particular, the district built a new school “in the middle of the Negro community,” where many blacks and few whites would attend it, rather than in a location that would promote integration.423 These actions persuaded the Court that the district “had engaged in . . . deliberate racial segregation.”424
Likewise, in a 1979 case, the Court confronted the school system of Columbus, whose near-east side was “then and now [a] black residential area.”425 The school district established “optional attendance zones” that “allowed students in a small, white enclave” in the near-east side “to escape attendance at black schools.”426 The district also provided for a “group of white students [to be] bused past their neighborhood school to a ‘whiter’ school.”427 And through “[g]errymandering of boundary lines,” the district ensured that “white residential areas were removed from the black school’s zone and black students were contained within that zone.”428 All of these steps had a segregative impact on Columbus’s schools because of the city’s underlying residential segregation. And in combination, they led to the Court’s conclusion that the district was guilty of “intentionally segregative actions.”429
While the liability stage of school desegregation litigation is important, it has become quite rare in recent years. According to one study, in only a single case since 1990 has a school district been found culpable and then ordered to adopt a mandatory student assignment plan.430 Far more frequent now is the unitary status proceeding, in which a district tries to convince a court that it should be released from judicial supervision.431 Unitary status is granted if a district has complied in good faith with a court’s desegregation order, and if any “vestiges of past discrimination ha[ve] been eliminated to the extent practicable.”432 “Vestiges” refer to racial imbalances in school enrollment and other areas,433 and are presumed to have been “proximately caused by intentional state action during the prior de jure era.”434
Under this framework, residential segregation often prevents the achievement of unitary status by reducing the effectiveness of integrative measures and so fostering school segregation. The school segregation then is deemed a vestige of the original constitutional violation that has yet to be eliminated. For instance, Louisville was under a school desegregation order in the 1970s, and also experienced a rise in residential segregation due to a “trend [ ] definitely toward ‘white flight.’”435 The segregative housing trend caused school attendance zones that had been designed to promote integration to stop working as planned. “[A]s blacks moved into [each] attendance area, the school would naturally become ‘blacker,’ particularly since whites would ‘flee.’”436 Many of Louisville’s schools thus remained racially identifiable, prompting the Sixth Circuit to hold that “[a]ll vestiges of state-imposed segregation have not been eliminated.”437
Similarly, Dallas was under a school desegregation order in the 1980s, when it “resemble[d] a pie in which one whole ‘wedge’ is made up of black residents, from the center of the district all the way to its outermost boundary.”438 This residential segregation, in combination with the city’s geographic sprawl and surging minority population, undermined all of the integrative policies the district attempted.439 Attendance zone adjustment produced only limited improvement in the face of the city’s difficult demography.440 Busing was infeasible due to the city’s traffic and size.441 And few students took advantage of voluntary majority-to-minority transfers that required them to enroll in schools far from their homes.442 Thanks to these obstacles, Dallas’s schools stayed highly segregated443 —and thanks to this persistent segregation, the court ruled that “vestiges of the previous segregated system remain today.”444
It is important to note, though, that residential segregation does not always prevent unitary status from being granted. Especially in more recent cases, it sometimes facilitates school districts’ release from judicial supervision. This is because courts today focus less on the extent of school segregation (which residential segregation tends to heighten), and more on districts’ responsibility for enrollment imbalances. Residential segregation is the most powerful force affecting school composition that is not under districts’ control. So if it is the only reason for continuing school segregation, then the resulting imbalances are not a vestige of the original constitutional violation. Rather, they are attributable to an independent demographic factor, and the chain of causality is broken.445
The most famous case of residential segregation helping a school district achieve unitary status arose in 1992 in DeKalb County, a suburban area near Atlanta. The county’s school system was placed under a desegregation order in 1969.446 In the ensuing years, “radical demographic changes” took place, causing the “northern half of DeKalb County [to become] predominantly white and the southern half [to become] predominantly black.”447 This residential trend, in turn, led to severe school segregation: “50% of the black students attended schools that were over 90% black,” while “27% of white students attended schools that were more than 90% white.”448 The Supreme Court nevertheless held that the district had earned unitary status. The “population changes which occurred . . . were not caused by the [district’s] policies,” so the “current racial imbalance” was not a “vestige of the prior de jure system.”449
The dual role that residential segregation plays at the unitary status stage—helping both to trigger and to rebut the presumption that continuing school segregation stems from the original constitutional violation—distinguishes this area from the others I have covered. The duality means that, here at least, residential segregation is not an unalloyed advantage for civil rights plaintiffs. Rather, it benefits them if courts emphasize the resulting enrollment imbalances (as they usually did before the 1990s). But it weakens plaintiffs’ position if courts stress the causal link between district policies and school segregation (as they tend to do today). Fortunately, this complexity does not apply to the doctrinal implications of rising residential integration. As I argue next, this trend usually assists school districts, at both the liability and unitary status stages.
Begin with the liability stage. Just as residential segregation can support an inference of segregative intent more or less directly, so too can residential integration lead to the opposite conclusion in more or less straightforward ways. More directly, integrating housing can result in integrating schools, from which an invidious motive is harder to deduce. More circuitously, residential integration can create conditions in which school district policies that otherwise would have a segregative effect in fact have neutral or integrative consequences. An intent to segregate then cannot be inferred as easily from a district’s adoption of these policies.
Both of these causal pathways were on display in a 1980s case from Prince George’s County, a suburban region adjoining Washington, DC.450 The county underwent “widespread and naturally occurring racial integration” during the 1970s, which caused the “distribution of th[e] minority population [to] become quite widespread and generalized.”451 The county also reduced its busing of students and established more neighborhood schools—steps that could have increased school segregation sharply, but did not due to the residential integration.452 Faced with this positive housing trend, as well as potentially segregative policies whose impact was blunted by the trend, the court could not find segregative intent. “[P]laintiffs have not met their burden of proving that defendants acted with a racially discriminatory purpose in implementing the [ ] busing reversals.”453
Likewise, Charles City County, Virginia, was residentially integrated in the 1960s, when there were “no predominantly White or Negro areas” and “[p]eople of all of the races reside[d] throughout the entire county.”454 The county adopted a freedom-of-choice plan that allowed each student to select which school to attend.455 Such plans often failed to achieve meaningful school integration in this era,456 but the county’s succeeded because of its favorable residential landscape. As the court observed, “freedom of choice had brought about a considerable amount of school desegregation,” and “every White student in the county presently attends an integrated school.”457 The court therefore upheld the plan, adding that it was “leading to the abolition of a system of segregation.”458
However, residential integration certainly does not preclude liability. In fact, if a school district enacts policies that manage to have a segregative effect despite an improvement in housing patterns, it may be easier to infer segregative intent. For example, “residential segregation in Rockford[, Illinois,] decreased during the 1970’s and 1980’s.”459 But school segregation rose in the district due to attendance zone manipulation and “the one-way busing of minority students.”460 The contrasting housing and enrollment trends convinced the court that the “clearly predominant cause of segregation in [Rockford] schools was the . . . affirmative segregative conduct by the [district], and not residential segregation.”461
Next consider the unitary status stage. Residential integration typically helps school districts seeking to be released from judicial supervision because it causes integrative measures to be more effective and so increases school integration. This improvement then suggests that there remain fewer (or no) vestiges of the original constitutional violation—and thus that districts can be trusted to manage their own affairs again. Enrollment statistics are vital evidence in any unitary status proceeding,462 and residential integration usually makes them more balanced.
For instance, Oklahoma City was under a school desegregation order in the 1990s, and experienced a remarkable drop in residential segregation during the two prior decades. Its black-white dissimilarity index fell from 87 percent in 1972 to 48 percent in 1992.463 Over this period, the school district relied on integrative techniques including “pairing, clustering, and compulsory busing.”464 Aided by the auspicious housing trend, these techniques led to a sharp decline in school segregation. The black-white dissimilarity index for the district’s schools plunged from 78 percent in 1971 to 24 percent in 1984.465 This impressive progress indicated that the district “had eradicated the vestiges of the dual system and was entitled to have the desegregation decree dissolved.”466
Similarly, Fort Worth was under a school desegregation order in the 1980s, and underwent the “natural integration of residential neighborhoods” in the 1970s.467 Areas that were “virtually all-white in 1970” became “more and more integrated according to 1980 census figures.”468 This improvement in housing patterns enhanced the integrative impact of school district policies such as busing and a “pyramid feeder system.”469 As the court noted, “the desegregation devi[c]es employed . . . were effective in integrating the schools.”470 The court therefore concluded that the district had “eliminat[ed] all vestiges of discrimination” and was “unitary in every respect.”471
But just as residential integration does not preclude liability, it also does not guarantee unitary status. If a school district fails to adopt integrative measures that take advantage of the favorable housing trend, then its school enrollments may remain racially imbalanced. In turn, these imbalances may be deemed vestiges of the original violation that require continued judicial supervision. This is precisely what happened to Topeka in the 1980s.472 Its black population “spread widely throughout the eastern part of the city” and also “beg[a]n to move into the western side.”473 But the district built new schools in areas where they “promot[ed] racial separation,” designed attendance zones that “did not further the process of desegregation,” and did not consider more potent remedies such as busing and magnet schools.474 As a result, Topeka’s schools did not integrate to the same extent as its homes, and the Tenth Circuit held that the district was not entitled to unitary status.475
Accordingly, residential integration is a contingent rather than an automatic asset for school districts, at both the liability and unitary status stages. It does set the stage for integrative policies to make schools markedly less segregated. But districts must bite the bullet and actually enact these policies. If they are unwilling to do so, their racial imbalances are likely to linger, and they may be unable to extricate themselves from litigation.
To this proviso, I should add the one I noted earlier in the FHA and VRA contexts—namely, that cases in which residential segregation benefits plaintiffs substantially outnumber those in which residential integration aids defendants.476 If anything, this caveat is even more important here. Unlike residential segregation, school segregation has not declined in recent years, but rather has held roughly constant.477 In addition, few school desegregation suits have been launched in the last generation.478 The set of cases in which residential integration could make a legal difference thus is doubly small: first, because the improvement in housing has yet to translate into equivalent progress in enrollments; and second, because the volume of relevant litigation is so low anyway.
But these are practical rather than conceptual qualifications. They do not undermine the key points that residential integration does complicate matters for school desegregation plaintiffs, and that these difficulties are apt to intensify as the integrative trend continues. They also do not challenge the statistical picture of school segregation I painted earlier. Below, then, I discuss the role that school desegregation law is likely to play in a more residentially integrated America. My outlook is conflicted—optimistic because of the tightening link between residential and school segregation, but skeptical because of the link’s inherent contingency and its irrelevance to certain racial imbalances.
From one angle, the prognosis for school desegregation doctrine is as positive as that for the FHA.479 One of the FHA’s goals is ending residential segregation. Likewise, the “ultimate end” of the doctrine is a “nonracial system of public education.”480 Residential segregation has fallen sharply in the last half century. So has school segregation (though with a lull since the late 1980s), and it should resume declining in the future now that it is tied so closely to residential segregation.481 Therefore both the FHA and school desegregation law are making progress toward the achievement of one of their core objectives. Cue the celebration.
Adding to the positivity is the fact that residential integration makes voluntary policies to desegregate schools—enacted in the absence of a court order—more likely to be upheld. For the sake of brevity, I have not covered the complex case law on the constitutionality of these measures.482 In brief, though, residential segregation often necessitates aggressive actions such as assigning students to schools on the basis of race, which are highly suspect under current law.483 In contrast, more modest steps such as adjusting attendance zones and basing school assignments on neighborhood (rather than student) characteristics can be quite effective under integrating conditions.484 These policies usually have been deemed valid by the courts,485 and if they were adopted more widely, they would lead to further school desegregation.
There are several flies in this ointment, though. First, even if school segregation declines at the same rate as residential segregation from this point forward (by no means a certainty), the resulting progress will be frustratingly slow. As noted earlier, the residential black-nonblack dissimilarity index has fallen by about 5 percentage points per decade since 1970.486 But the typical court desegregation order in the 1960s and 1970s resulted in a 20 percentage point decrease in school segregation within just two years487 —and there were cases of decrees producing as much as an 80 percentage point drop.488 Sitting back and allowing the favorable housing trend to take its course thus is plainly a less productive strategy than judicial intervention or voluntary desegregation. Passivity is likely to produce gains, but only incremental ones.
Second, as I have stressed, the relationship between residential segregation and school segregation is highly contingent on school district policies. At present, most districts have chosen policies, neighborhood schools in particular, that cause residential segregation to be an excellent predictor of school segregation.489 But in the future, districts could take actions, such as attendance zone manipulation, new school construction, and certain school choice initiatives, that prevent declines in residential segregation from materializing in school systems.490 True, these measures could be challenged on the ground that they were adopted with segregative intent. But lawsuits of this sort seldom have succeeded in recent years.491
And third, racial imbalances in enrollments are not the only ones that school desegregation doctrine seeks to eliminate. In a 1968 case, the Supreme Court famously held that the doctrine applies “not just to the composition of student bodies” but also to “every facet of school operations—faculty, staff, transportation, extracurricular activities, and facilities.”492 These other areas, however, are largely unrelated to residential patterns. That housing is integrating in a school district does not mean that its teachers are allocated without regard to race, that its minority and white students have access to the same resources, or that its schools are equally conducive to learning. Whatever optimism stems from the residential progress, then, does not extend to aspects of school systems that are mostly impervious to it.
Putting aside these aspects (which are beyond this project’s scope), how could the law promote more extensive school integration?493 One option, alluded to above, would be to permit all voluntary desegregation policies, including explicitly race-conscious ones. The more limited measures that courts currently allow are helpful, especially in areas where residential patterns are integrating.494 But as Frankenberg and Professor Genevieve Siegel-Hawley observe, they are “less likely to produce racial integration than former plans that relied upon race as a single assignment criteri[on].”495 If these former plans were put back on the table, they could generate larger gains than their weaker replacements.
Another possibility would be to tighten the connection between school segregation on the one hand and liability and the maintenance of judicial supervision on the other. If segregative intent could be inferred more directly from segregated schools, then plaintiffs would have less difficulty establishing culpability and compelling school districts to take desegregative actions.496 Similarly, if the presumption that enrollment imbalances result from the original constitutional violation were strengthened, then districts’ ability to attain unitary status—and then switch to neighborhood schools—would be curtailed. The stark reality of racially separated schools again would become the doctrine’s fulcrum.
Of course, both of these suggestions fly in the face of recent Supreme Court decisions. The Court has rejected overtly race-conscious voluntary desegregation.497 It also has made it progressively easier for school districts to be deemed unitary, even if their schools (and homes) remain segregated.498 Given current law, then, the best course of action for proponents of school integration simply may be to sue more often. Yes, new school desegregation suits are a rarity these days.499 But unlike unitary status proceedings, the doctrine that applies to them has not been narrowed by the Court’s recent precedents. Many examples also exist, from around the country and over several decades, of plaintiffs managing to prove illicit intent even in the absence of formal segregative policies.500 And as several commentators have noted, there is no shortage today of district practices that certainly seem aimed at keeping students racially separated.501
This is not to say that litigation should be launched willy-nilly. Especially in minority-heavy urban districts in the Midwest and Northeast, there may be little that suits can accomplish given the usual ban on interdistrict remedies.502 But districts in the South and West tend to encompass both minority-heavy urban areas and whiter suburban and exurban regions.503 In the Midwest and Northeast too, suburban districts are becoming ever more diverse.504 There would be a wide array of targets, then, for a renewed campaign to combat school segregation through the courts. Such a campaign might lose many of its battles—but the ones it won likely would produce more integration than any other tactic.505
I have tried to make two contributions in this Article. The first is to document and then explain the striking decline in residential segregation since 1970. This decline is one of the most important sociological developments of the last half century. But to date, it has not been noticed by, let alone incorporated into, the law. The second is to explore how three bodies of civil rights doctrine—involving housing discrimination, vote dilution, and school segregation—are connected to racial groups’ housing patterns. My central claim is that all three bodies historically have relied on the existence of residential segregation, and that all three are unsettled by integration. Their role in a less racially separated America thus urgently needs to be rethought.
This Article may come too late for some readers, and too soon for others. Too late because segregation has the ring of a bygone era, a time when the country paid more heed to, and worked harder to repair, its racial and spatial divisions.506 And too soon because our homes and schools, despite the progress they have made, remain far from integrated. I would prefer to think, though, that the Article’s timing is quite apt. It is never overdue to call attention to where people choose to live or enroll their children. It also is hardly premature to reflect on the legal implications of desegregation. The trend is undeniable, it already is disrupting settled doctrine in several areas, and its impact only will grow in the future. The sooner the law begins to grapple with it, the better.
- 43Otis Dudley Duncan and Beverly Duncan, A Methodological Analysis of Segregation Indexes, 20 Am Sociological Rev 210, 210 (1955). The Duncans also concluded that “there is little information in any of the indexes beyond that contained in the index [of dissimilarity] and the city nonwhite proportion.” Id at 214.
- 44Douglas S. Massey and Nancy A. Denton, The Dimensions of Residential Segregation, 67 Soc Forces 281, 282 (1988).
- 45See id at 283. See also generally Sean F. Reardon and Glenn Firebaugh, Measures of Multigroup Segregation, 32 Sociological Methodology 33 (2002) (defining and assessing six measures of multigroup segregation); Michael J. White, Segregation and Diversity Measures in Population Distribution, 52 Population Index 198 (1986) (defining and assessing ten measures of biracial segregation).
- 46See Sean F. Reardon and David O’Sullivan, Measures of Spatial Segregation, 34 Sociological Methodology 121, 125 (2004) (observing that “if we derived a segregation measure from information about the exact locations and spatial environments of individuals . . . there would be no conceptual distinction at all between evenness and clustering”); id at 127 (noting that “centralization and concentration dimensions can be seen as specific subcategories of spatial unevenness”).
- 47See Claude S. Fischer, et al, Distinguishing the Geographic Levels and Social Dimensions of U.S. Metropolitan Segregation, 1960–2000, 41 Demography 37, 41 (2004) (calling the dissimilarity index “perhaps the most common” measure of segregation); Salvatore Saporito and Deenesh Sohoni, Coloring outside the Lines: Racial Segregation in Public Schools and Their Attendance Boundaries, 79 Sociology of Educ 81, 93 (2006) (characterizing the dissimilarity index as “the ‘workhorse’ of segregation measures”).
- 48See Massey and Denton, 67 Soc Forces at 284 (cited in note 44) (defining the dissimilarity index mathematically).
- 49Iceland and Sharp, 32 Population Rsrch & Pol Rev at 670 (cited in note 41) (calling the isolation index “the most widely used measure of exposure”) (emphasis omitted); Andrew L. Spivak and Shannon M. Monnat, The Influence of Race, Class, and Metropolitan Area Characteristics on African-American Residential Segregation, 94 Soc Sci Q 1414, 1419 (2013) (describing the isolation index as one of “two types of exposure indices commonly used to measure residential segregation”).
- 50See Massey and Denton, 67 Soc Forces at 288 (cited in note 44) (defining the isolation index mathematically).
- 51Id at 282.
- 52See, for example, Jeffrey M. Timberlake and John Iceland, Change in Racial and Ethnic Residential Inequality in American Cities, 1970–2000, 6 City & Community 335, 340 (2007) (noting historical consensus among some experts that “the index of dissimilarity [ ] was the best measure of residential segregation when conceptualized as evenness of population distribution”).
- 53See John Iceland, Where We Live Now: Immigration and Race in the United States 41 (California 2009) (“The dissimilarity index has the advantage of not being sensitive to the relative size of the groups in question.”).
- 54Iceland, Sharp, and Timberlake, 50 Demography at 103 (cited in note 11).
- 55See Reardon and Firebaugh, 32 Sociological Methodology at 34 (cited in note 45) (“[T]he major methodological developments in segregation measurement have been limited to measuring segregation between two population groups.”).
- 56In particular, blacks are the only minority group for which historical segregation statistics back to the nineteenth century are available. See, for example, Massey and Denton, American Apartheid at 21 (cited in note 3) (citing segregation statistics for blacks from circa 1860); Glaeser and Vigdor, The End of the Segregated Century at *3–4 (cited in note 11) (citing segregation statistics for blacks from 1890).
- 57See, for example, John Iceland, The Multigroup Entropy Index (Also Known as Theil’s H or the Information Theory Index) *7–8 (Dec 2004), archived at http://perma.cc/H8PU-FD7K (defining the entropy index mathematically); Reardon and Firebaugh, 32 Sociological Methodology at 37 (cited in note 45) (same). Scholars also have devised explicitly spatial measures that take into account where exactly people are located. See, for example, Reardon and O’Sullivan, 34 Sociological Methodology at 136–44 (cited in note 46); Barrett A. Lee, et al, Beyond the Census Tract: Patterns and Determinants of Racial Segregation at Multiple Geographic Scales, 73 Am Sociological Rev 766, 770–73 (2008). These metrics are used even more infrequently than the multigroup ones.
- 58See Mary J. Fischer, The Relative Importance of Income and Race in Determining Residential Outcomes in U.S. Urban Areas, 1970-2000, 38 Urban Affairs Rev 669, 676 (2003) (“One advantage of entropy-based measures is this ability to examine segregation between more than two groups simultaneously.”). Also, usefully, the entropy index is additive and so can be subdivided between different geographic levels. See id at 675.
- 59See, for example, Chad R. Farrell, Bifurcation, Fragmentation or Integration? The Racial and Geographical Structure of US Metropolitan Segregation, 1990–2000, 45 Urban Stud 467, 468 (2008) (“The measurement of segregation usually entails an effort to quantify the unequal distribution of social groups across smaller geographical units . . . within a larger region.”).
- 60Census Tracts and Block Numbering Areas, archived at http://perma.cc/QN6G
-BSRQ, in Geographic Areas Reference Manual *10-1, 10-1 (Bureau of the Census, Nov 1994), archived at http://perma.cc/96L8-FD65. See also, for example, Iceland and Sharp, 32 Population Rsrch & Pol Rev at 669 (cited in note 41) (“Census tracts are also by far the unit most used in research on residential segregation.”). - 61Metropolitan Areas, archived at http://perma.cc/U4DX-AWFH, in Geographic Areas Reference Manual *13-1, 13-1 (cited in note 60). See also J. Eric Oliver, The Paradoxes of Integration: Race, Neighborhood, and Civic Life in Multiethnic America 23 (Chicago 2010); Iceland, Sharp, and Timberlake, 50 Demography at 101 (cited in note 11) (“Residential segregation usually refers to the distribution of groups . . . within metropolitan areas.”).
- 62In general, the smaller the subunit considered, the higher the resulting segregation score. More variation is expressed between rather than within smaller subunits. See David W.S. Wong, Spatial Dependency of Segregation Indices, 41 Canadian Geographer 128, 130–31 (1997). However, areas’ segregation rankings tend not to change much when different subunits are used. See Sean F. Reardon, et al, The Geographic Scale of Metropolitan Racial Segregation, 45 Demography 489, 499 (2008).
- 63See Glaeser and Vigdor, The End of the Segregated Century at *4 (cited in note 11). See also Massey and Denton, American Apartheid at 21, 47 (cited in note 3) (providing dissimilarity index scores for selected cities from 1860 to 1970).
- 64See Glaeser and Vigdor, The End of the Segregated Century at *4 (cited in note 11). Unfortunately, Glaeser and Vigdor do not calculate black-white segregation statistics, which are usually slightly higher. I am unaware of any work presenting black-white figures over such a long period.
- 65See id. Glaeser and Vigdor use an idiosyncratic definition of the isolation index, adjusting its values downward by the black share of the metropolitan area population. See id at *3. The index then “measures the tendency for members of one group to live in neighborhoods where their share of the population is above the citywide average.” Id (emphasis added).
- 66David M. Cutler, Edward L. Glaeser, and Jacob L. Vigdor, The Rise and Decline of the American Ghetto, 107 J Polit Econ 455, 458 (1999); Rachel E. Dwyer, Poverty, Prosperity, and Place: The Shape of Class Segregation in the Age of Extremes, 57 Soc Probs 114, 123 (2010).
- 67See Massey and Denton, 26 Demography at 383 (cited in note 4).
- 68Measured the usual way, again, the peak isolation was somewhat higher than reported by Glaeser and Vigdor. See note 65. See also Rugh and Massey, 11 Du Bois Rev at 213 (cited in note 14) (showing 1970 black-white isolation of about 67 percent).
- 69See Glaeser and Vigdor, The End of the Segregated Century at *4 (cited in note 11).
- 70See Iceland and Sharp, 32 Population Rsrch & Pol Rev at 673 (cited in note 41) (providing data from 1980 to 2010). Their isolation index score of around 45 percent appears higher than Glaeser and Vigdor’s only because they do not adjust downward by the black share of the metropolitan area population. See note 65.
- 71See Frey, Diversity Explosion at 169, 173 (cited in note 11) (providing data from 1930 to 2010).
- 72See Farley, 10 Contexts at 39 (cited in note 10) (providing data from 1980 to 2010).
- 73See Logan and Stults, The Persistence of Segregation at *4 (cited in note 40) (providing data from 1940 to 2010). However, Logan and Stults find that black-white exposure has been roughly constant since 1940, due to whites’ declining share of the overall population. See id at *4–5.
- 74See Rugh and Massey, 11 Du Bois Rev at 212 (cited in note 14) (providing data from 1970 to 2010).
- 75See David M. Cutler, Edward L. Glaeser, and Jacob L. Vigdor, Is the Melting Pot Still Hot? Explaining the Resurgence of Immigration Segregation, 90 Rev Econ & Stat 478, 482 (2008) (showing dissimilarity scores at or above 50 percent for all of these groups in 2000).
- 76See Frey, Diversity Explosion at 155 (cited in note 11); Glaeser and Vigdor, The End of the Segregated Century at *2 (cited in note 11) (“[T]he dominant trend in predominantly black neighborhoods nationwide has been population loss.”). This exodus seems to be fulfilling Professor William Julius Wilson’s famous prediction that, as middle- and upper-income blacks exit inner-city areas, “the truly disadvantaged” will be left behind. See generally William Julius Wilson, The Truly Disadvantaged: The Inner City, the Underclass, and Public Policy (Chicago 1987). A new frontier for civil rights law may be how to address the particular needs of “the truly disadvantaged,” as opposed to those of blacks generally.
- 77See Myron Orfield and Thomas F. Luce, America’s Racially Diverse Suburbs: Opportunities and Challenges, 23 Housing Pol Debate 395, 401 (2013) (finding that “[d]iverse suburbs” now “represent the largest single suburban segment—53 million people in 2010, up from 40 million in 2000”). See also Ingrid Gould Ellen, How Integrated Did We Become during the 1990s?, in John Goering, ed, Fragile Rights within Cities: Government, Housing, and Fairness 123, 130 (Rowman & Littlefield 2007) (showing that the proportion of nearly all-white census tracts fell from about 60 percent in 1970 to about 15 percent in 2000); Frey, Diversity Explosion at 159–66 (cited in note 11).
- 78See Maly, Beyond Segregation at 48–213 (cited in note 9) (discussing these neighborhoods); Philip Nyden, Michael Maly, and John Lukehart, The Emergence of Stable Racially and Ethnically Diverse Urban Communities: A Case Study of Nine U.S. Cities, 8 Housing Pol Debate 491, 492 (1997) (surveying “communities where racial and ethnic diversity has been maintained for as long as 30 years”).
- 79See Ellen, How Integrated Did We Become during the 1990s? at 134 (cited in note 77) (finding that the stability of neighborhoods with black populations between 10 percent and 50 percent “rose from 62 percent during the 1970s to 78 percent during the 1980s . . . to 80 percent during the 1990s”); Chad R. Farrell and Barrett A. Lee, Racial Diversity and Change in Metropolitan Neighborhoods, 40 Soc Sci Rsrch 1108, 1116–18 (2011) (finding that several types of integrated neighborhoods have stability rates above 50 percent, which are still lower than the stability rates of homogeneous communities); Samantha Friedman, Do Declines in Residential Segregation Mean Stable Neighborhood Racial Integration in Metropolitan America? A Research Note, 37 Soc Sci Rsrch 920, 927 (2008) (same).
- 80See Iceland, Sharp, and Timberlake, 50 Demography at 106 (cited in note 11).
- 81See id. See also Frey, Diversity Explosion at 114–30 (cited in note 11) (discussing the “historic reversal” of black regional migration back to the South and its metropolitan areas).
- 82See Glaeser and Vigdor, The End of the Segregated Century at *8–9 (cited in note 11) (arriving at the one-fifth figure); Iceland, Sharp, and Timberlake, 50 Demography at 115 (cited in note 11) (finding that interregional migration accounts for 12 percent of the decline in black-white dissimilarity and 8 percent of the decline in black-nonblack dissimilarity).
- 83See Ellen, How Integrated Did We Become during the 1990s? at 133 (cited in note 77); Farrell and Lee, 40 Soc Sci Rsrch at 1117 (cited in note 79); Friedman, 37 Soc Sci Rsrch at 927 (cited in note 79).
- 84See Friedman, 37 Soc Sci Rsrch at 927 (cited in note 79).
- 85For a general analysis of the dynamics of gentrification, see generally Terra McKinnish, Randall Walsh, and T. Kirk White, Who Gentrifies Low-Income Neighborhoods?, 67 J Urban Econ 180 (2010).
- 86Glaeser and Vigdor, The End of the Segregated Century at *9 (cited in note 11).
- 87See Iceland and Sharp, 32 Population Rsrch & Pol Rev at 668 n 1 (cited in note 41) (“The challenge with using 1970 data is that one cannot distinguish between the ‘white’ and ‘non-Hispanic white’ population in census public use files. We also do not have data on the number of Asians in that year.”).
- 88See text accompanying note 66 (noting that dissimilarity scores in the 30 percent to 60 percent range indicate moderate segregation).
- 89Rugh and Massey, 11 Du Bois Rev at 212–13 (cited in note 14); Glaeser and Vigdor, The End of the Segregated Century at *9 (cited in note 11). All of these studies weight metropolitan area values by the areas’ Hispanic or Asian American populations.
- 90See Farley, 10 Contexts at 39 (cited in note 10) (using whites as the reference group).
- 91See Iceland and Sharp, 32 Population Rsrch & Pol Rev at 673 (cited in note 41) (using nonminorities as the reference group).
- 92See Logan and Stults, The Persistence of Segregation at *11, 17 (cited in note 40) (using whites as the reference group).
- 93Rugh and Massey, 11 Du Bois Rev at 213 (cited in note 14). See also Iceland and Sharp, 32 Population Rsrch & Pol Rev at 673 (cited in note 41) (showing a gentler rise due to the use of nonminorities as the reference group).
- 94See text accompanying note 54 (noting that the isolation index is sensitive to groups’ population shares).
- 95See Iceland, Where We Live Now at 58 (cited in note 53) (using whites as the reference group).
- 96See id. See also id at 63–68 (showing similar results for specific countries of origin); Daniel T. Lichter, et al, Residential Segregation in New Hispanic Destinations: Cities, Suburbs, and Rural Communities Compared, 39 Soc Sci Rsrch 215, 222 (2010) (finding that Hispanic-white segregation is higher in “new destinations” than in “established Hispanic places”).
- 97See Frey, Diversity Explosion at 178 (cited in note 11) (“[T]he average ‘static’ segregation picture for Hispanics and Asians conflates both a turn toward integration among long-term residents and higher segregation levels among new immigrants.”).
- 98Milliken v Bradley, 418 US 717, 756 n 2 (1974) (Stewart concurring).
- 99Glaeser and Vigdor, The End of the Segregated Century at *4 (cited in note 11) (left graph); Rugh and Massey, 11 Du Bois Rev at 212 (cited in note 14) (top-right graph); Rugh and Massey, 11 Du Bois Rev at 213 (cited in note 14) (bottom-right graph).
- 100See Massey and Denton, American Apartheid at 17–59 (cited in note 3) (describing these and other discriminatory governmental policies).
- 101See id at 83–114 (discussing these and other discriminatory private practices).
- 102See notes 100–01.
- 103See Turner, et al, Housing Discrimination against Racial and Ethnic Minorities at *xix (cited in note 15).
- 104See id at *5–11 (discussing paired testing protocols).
- 105See id at *3 (“When large numbers of consistent and comparable tests are conducted . . . they directly measure patterns of adverse treatment based on race or ethnicity.”).
- 106See id at *68.
- 107See Turner, et al, Housing Discrimination against Racial and Ethnic Minorities at *68 (cited in note 15). All of these percentages are net figures that indicate how often the nonminority tester is favored minus how often the minority tester is favored. See id at *xii.
- 108See id at *68. However, the trend for homes is more static. See id.
- 109See id. For examples of other scholars noticing these encouraging developments, see Ingrid Gould Ellen, Continuing Isolation: Segregation in America Today, in James H. Carr and Nandinee K. Kutty, eds, Segregation: The Rising Costs for America 261, 265–66 (Routledge 2008); Bo Zhao, Jan Ondrich, and John Yinger, Why Do Real Estate Brokers Continue to Discriminate? Evidence from the 2000 Housing Discrimination Study, 59 J Urban Econ 394, 409–10 (2006).
- 110Cutler, Glaeser, and Vigdor, 107 J Polit Econ at 483 (cited in note 66).
- 111See id at 483–87.
- 112Stephen L. Ross, Understanding Racial Segregation: What Is Known about the Effect of Housing Discrimination *17 (University of Connecticut Economics Working Paper No 2008-15R, Nov 2008), archived at http://perma.cc/7CGD-PEWR.
- 113See George C. Galster, Housing Discrimination and Urban Poverty of African-Americans, 2 J Housing Rsrch 87, 94–107 (1991).
- 114Id at 113.
- 115See Massey and Denton, American Apartheid at 109 (cited in note 3) (commenting that Galster “confirmed the empirical link between discrimination and segregation”).
- 116See generally Thomas C. Schelling, Dynamic Models of Segregation, 1 J Math Sociology 143 (1971).
- 117See id at 148.
- 118See Bell and Parchomovsky, 100 Colum L Rev at 1987 (cited in note 8) (relying on Schelling’s assumptions).
- 119See id at 1985–87 (discussing the “tipping” phenomenon); Schelling, 1 J Math Sociology at 181–86 (cited in note 116) (same). There are additional complexities to Schelling’s model, such as the distributions of whites’ and blacks’ preferences, that I do not address here.
- 120See Schelling, 1 J Math Sociology at 171 (cited in note 116) (“The outcome depends on the shapes we attribute to the tolerance schedules [of blacks and whites].”).
- 121See Farley, 10 Contexts at 39–41 (cited in note 10).
- 122See id at 40.
- 123See id. For examples of other scholars noting this improvement, see Camille Zubrinsky Charles, The Dynamics of Racial Residential Segregation, 29 Ann Rev Sociology 167, 184 (2003); David R. Harris, Why Are Whites and Blacks Averse to Black Neighbors?, 30 Soc Sci Rsrch 100, 101 (2001). Black residential preferences largely held steady over this period, reflecting “a clear preference for 50/50 neighborhoods.” Camille Zubrinsky Charles, Who Will Live Near Whom?, 17 Poverty & Race 1, 2 (Sept/Oct 2008).
- 124Lawrence D. Bobo, Racial Attitudes and Relations at the Close of the Twentieth Century, in Neil J. Smelser, William Julius Wilson, and Faith Mitchell, eds, 1 America Becoming: Racial Trends and Their Consequences 264, 270 (National Academy 2001).
- 125See id. See also Howard Schuman, Charlotte Steeh, and Lawrence Bobo, Racial Attitudes in America: Trends and Interpretations 112 (Harvard 1985) (showing similar trends up to the late 1970s).
- 126See Cutler, Glaeser, and Vigdor, 107 J Polit Econ at 488–90 (cited in note 66).
- 127Id. See also Rugh and Massey, 11 Du Bois Rev at 216 (cited in note 14) (finding that antiblack racism, measured by the frequency of Google searches for racial slurs, is a “powerful and highly significant” driver of the black-white dissimilarity index).
- 128See David Card, Alexandre Mas, and Jesse Rothstein, Tipping and the Dynamics of Segregation, 123 Q J Econ 177, 180–91 (2008); David Card, Alexandre Mas, and Jesse Rothstein, Are Mixed Neighborhoods Always Unstable? Two-Sided and One-Sided Tipping *5–13 (NBER Working Paper No 14470, Nov 2008), archived at http://perma.cc/3AD9-K9HL.
- 129See Card, Mas, and Rothstein, Are Mixed Neighborhoods Always Unstable? at *21 (cited in note 128).
- 130See Card, Mas, and Rothstein, 123 Q J Econ at 192 (cited in note 128).
- 131See generally Schuman, Steeh, and Bobo, Racial Attitudes in America (cited in note 125) (finding decreases in racism in many areas). See also Iceland and Sharp, 32 Population Rsrch & Pol Rev at 666 (cited in note 41) (“The proportion of Whites holding blatantly racist attitudes has dropped considerably over the decades.”).
- 132See Logan and Zhang, 115 Am J Sociology at 1088 (cited in note 18) (showing an increase in the number of multiracial, white-black-Hispanic-Asian (WBHA) tracts from 2,422 in 1980 to 3,792 in 2000).
- 133See id at 1093. See also note 79 and accompanying text (noting the increased stability of multiracial neighborhoods).
- 134See Logan and Zhang, 115 Am J Sociology at 1091–92 (cited in note 18) (showing that almost all WBHA tracts experienced increases in their white and black population shares in the period between 1980 and 2000).
- 135See id.
- 136See Frey, Diversity Explosion at 174 (cited in note 11) (noting that “other minorities can serve to ‘buffer’ these [white-black] divisions”); Iceland, Where We Live Now at 6 (cited in note 53) (observing that “immigration has softened the black-white divide”).
- 137People’s incomes are still another potential driver of segregation. It could arise because different racial groups have different average incomes, and so can afford to live in different neighborhoods. Historically, income made almost no difference for black segregation; rich blacks were just about as racially separated as poor blacks. Other factors, such as housing discrimination and divergent residential preferences, thus were responsible for black segregation. See, for example, Massey and Denton, American Apartheid at 86 (cited in note 3); Camille Zubrinsky Charles, Neighborhood Racial-Composition Preferences: Evidence from a Multiethnic Metropolis, 47 Soc Probs 379, 380 (2000). But in recent years, income has become a better predictor of how segregated blacks are. Wealthy blacks are now substantially less racially separated than disadvantaged ones. This confirms the account of discrimination and residential preferences no longer obstructing integration to the same extent. See, for example, Iceland, Where We Live Now at 47 (cited in note 53); Lincoln Quillian, Why Is Black-White Residential Segregation So Persistent?: Evidence on Three Theories from Migration Data, 31 Soc Sci Rsrch 197, 218–20 (2002).
- 138See Iceland, Sharp, and Timberlake, 50 Demography at 100, 110 (cited in note 11); John R. Logan, Brian J. Stults, and Reynolds Farley, Segregation of Minorities in the Metropolis: Two Decades of Change, 41 Demography 1, 13, 15 (2004); Rugh and Massey, 11 Du Bois Rev at 217, 218 (cited in note 14); Timberlake and Iceland, 6 City & Community at 352 (cited in note 52).
- 139See Iceland, Sharp, and Timberlake, 50 Demography at 100, 110 (cited in note 11); Logan, Stults, and Farley, 41 Demography at 14, 15 (cited in note 138); Rugh and Massey, 11 Du Bois Rev at 211, 217 (cited in note 14); Timberlake and Iceland, 6 City & Community at 352 (cited in note 52).
- 140See Iceland, Sharp, and Timberlake, 50 Demography at 100, 110 (cited in note 11); Logan, Stults, and Farley, 41 Demography at 15, 16 (cited in note 138); Rugh and Massey, 11 Du Bois Rev at 217, 218 (cited in note 14); Timberlake and Iceland, 6 City & Community at 352, 357 (cited in note 52).
- 141See Jonathan T. Rothwell, Racial Enclaves and Density Zoning: The Institutionalized Segregation of Racial Minorities in the United States, 13 Am L & Econ Rev 290, 314, 347–48 (2011); Jonathan Rothwell and Douglas S. Massey, The Effect of Density Zoning on Racial Segregation in U.S. Urban Areas, 44 Urban Affairs Rev 779, 780–82, 792 (2009); Rugh and Massey, 11 Du Bois Rev at 217, 219–23 (cited in note 14).
- 142See notes 80–82 and accompanying text (discussing black migration patterns).
- 143See Iceland, Sharp, and Timberlake, 50 Demography at 112 (cited in note 11).
- 144Rothwell, 13 Am L & Econ Rev at 345 (cited in note 141). See also Rothwell and Massey, 44 Urban Affairs Rev at 793 (cited in note 141).
- 145Iceland, Where We Live Now at 104 (cited in note 53). See also Frey, Diversity Explosion at 176 (cited in note 11) (“[N]ew forces affecting black-white segregation are ushering in an era that will be quite different from the era of wholesale ghettoization of the black population.”).
- 146Turner, et al, Housing Discrimination against Racial and Ethnic Minorities at *68 (cited in note 15) (top graphs); Farley, 10 Contexts at 40 (cited in note 10) (bottom graph).
- 147See Logan and Stults, The Persistence of Segregation at *6–7 (cited in note 40) (covering only the fifty metropolitan areas with the largest black populations).
- 148See id. See also Glaeser and Vigdor, The End of the Segregated Century at *11–26 (cited in note 11) (providing 2010 black-nonblack dissimilarity scores for all metropolitan areas).
- 149Iceland, Sharp, and Timberlake, 50 Demography at 107 (cited in note 11). See also Rugh and Massey, 11 Du Bois Rev at 221 (cited in note 14) (showing very slow black-white dissimilarity decline for the five most segregated metropolitan areas).
- 150For a sampling of the vast literature documenting the ill effects of segregation, see Massey and Denton, American Apartheid at 1–16, 115–216 (cited in note 3); Oliver, The Paradoxes of Integration at 147 (cited in note 61); Charles, 29 Ann Rev Sociology at 197–99 (cited in note 123); Cutler, Glaeser, and Vigdor, 107 J Polit Econ at 495–96 (cited in note 66). Based on this literature, I assume here that integration is desirable and segregation is an evil to be avoided. But due to space constraints, I do not defend this assumption at any length.
- 151See Matthew Hall, Kyle Crowder, and Amy Spring, Neighborhood Foreclosures, Racial/Ethnic Transitions, and Residential Segregation, 80 Am Sociological Rev 526, 534 (2015). See also Jacob S. Rugh and Douglas S. Massey, Racial Segregation and the American Foreclosure Crisis, 75 Am Sociological Rev 629, 639 (2010) (finding that the foreclosure rate was higher in metropolitan areas with higher black-white dissimilarity scores).
- 152See Hall, Crowder, and Spring, 80 Am Sociological Rev at 536 (cited in note 151).
- 153See id at 540 (finding in addition a rise of about 2 percent in the Hispanic-white dissimilarity index).
- 154See id. See also Richard Rothstein, A Comment on Bank of America/Countrywide’s Discriminatory Mortgage Lending and Its Implications for Racial Segregation *3 (Economic Policy Institute, Jan 23, 2012), archived at http://perma.cc/3SGL-4HRW (speculating that blacks whose homes were foreclosed may have had to “return to more racially isolated and poorer ghettos,” thus also increasing black segregation).
- 155See Fischer, et al, 41 Demography at 47 (cited in note 47) (providing data from 1960 to 2000); Daniel T. Lichter, Domenico Parisi, and Michael C. Taquino, Toward a New Macro-Segregation? Decomposing Segregation within and between Metropolitan Cities and Suburbs, 80 Am Sociological Rev 843, 856 (2015) (providing data from 1990 to 2010).
- 156See Lichter, Parisi, and Taquino, 80 Am Sociological Rev at 856 (cited in note 155). Notably, Professors Daniel Lichter, Domenico Parisi, and Michael Taquino report a rise in the share of total segregation explained by macro components, but the actual level of macro segregation has remained about the same. See id.
- 157Reardon and Bischoff, 116 Am J Sociology at 1117 (cited in note 42).
- 158See id at 1110–14 (referring to this metric as “the rank-order information theory index”).
- 159See id at 1117. See also Sean F. Reardon and Kendra Bischoff, Growth in the Residential Segregation of Families by Income, 1970-2009 *16 (US2010 Project, Nov 2011), archived at http://perma.cc/QW6W-WHKR (showing increases in the segregation of high- and low-income families in large and moderately sized metropolitan areas from 1970 to 2009); Fischer, et al, 41 Demography at 50 (cited in note 47) (same for the period between 1960 and 2000); Douglas S. Massey, Jonathan Rothwell, and Thurston Domina, The Changing Bases of Segregation in the United States, 626 Annals Am Acad Polit & Soc Sci 74, 82 (2009) (showing increases in the neighborhood sorting index and in poor-rich dissimilarity from 1970 to 2000).
- 160See Reardon and Bischoff, 116 Am J Sociology at 1138 (cited in note 42) (concluding that “increasing income inequality was responsible for 40%–80% of the changes in income segregation from 1970 to 2000”).
- 161See id at 1120. See also Reardon and Bischoff, Growth in the Residential Segregation of Families by Income at *16 (cited in note 159); Fischer, et al, 41 Demography at 50 (cited in note 47).
- 162See Massey, Rothwell, and Domina, 626 Annals Am Acad Polit & Soc Sci at 84 (cited in note 159) (calculating the index using tracts as subunits).
- 163See id at 86 (calculating the index using congressional districts as subunits).
- 164See Dwyer, 57 Soc Probs at 130–31 (cited in note 66). See also Richard Florida and Charlotta Mellander, Segregated City: The Geography of Economic Segregation in America’s Metros *19–20 (Martin Prosperity Institute, Feb 2015), archived at http://perma.cc/7GWC-MTB7 (finding that the wealthy are more segregated in metropolitan areas with higher black population shares).
- 165See Reardon and Bischoff, 116 Am J Sociology at 1117 (cited in note 42).
- 166See id at 1139.
- 167See Carmen DeNavas-Walt, Bernadette D. Proctor, and Jessica C. Smith, Income, Poverty, and Health Insurance Coverage in the United States: 2011 *5 (US Census Bureau, Sept 2012), archived at http://perma.cc/86XG-4868.
- 168See Jiaquan Xu, et al, Deaths: Final Data for 2007, 58 Natl Vital Stat Rep *1, 8 (May 20, 2010), archived at http://perma.cc/R7FG-GPHJ.
- 169See King’s Dream Remains an Elusive Goal; Many Americans See Racial Disparities *31 (Pew Research Center, Aug 22, 2013), archived at http://perma.cc/U3DE-UNG4.
- 170See Nicholas O. Stephanopoulos, Political Powerlessness, 90 NYU L Rev 1527, 1580–94 (2015).
- 171Iceland, Sharp, and Timberlake, 50 Demography at 107 (cited in note 11) (top graph); Reardon and Bischoff, 116 Am J Sociology at 1117 (cited in note 42) (bottom graph).
- 172Pub L No 95-128, 91 Stat 1147, codified at 12 USC § 2901 et seq.
- 173See 91 Stat at 1147, codified at 12 USC § 2901(a)(1) (requiring banks “by law to demonstrate that their deposit facilities serve the convenience and needs of the communities in which they are chartered to do business”).
- 174Pub L No 88-352, 78 Stat 241, codified as amended at 42 USC § 2000a et seq.
- 175See 78 Stat at 252, codified at 42 USC § 2000d (“No person in the United States shall, on the ground of race, color, or national origin, be excluded from participation in, be denied the benefits of, or be subjected to discrimination under any program or activity receiving Federal financial assistance.”).
- 176See, for example, Wards Cove Packing Co v Atonio, 490 US 642, 647–48 (1989) (linking “racial stratification of the work force” to “racially segregated housing”).
- 177To be clear about terms, I am distinguishing “discrimination” from “segregation” here, not from “disparate impact.” Both disparate treatment and disparate impact claims can proceed under both antidiscrimination and desegregation theories.
- 17842 USC §§ 3604–06.
- 17942 USC § 3604(a).
- 18042 USC § 3604(b).
- 18142 USC § 3604(d).
- 18242 USC § 3604(a).
- 18342 USC § 3601.
- 18442 USC § 3608(d).
- 185See Texas Department of Housing and Community Affairs v Inclusive Communities Project, Inc, 135 S Ct 2507, 2525–26 (2015) (holding that a disparate impact theory is cognizable under the FHA).
- 186Note that I cover only those elements of FHA (and VRA and school desegregation) doctrine that are linked to racial groups’ residential patterns. I do not discuss the numerous doctrinal elements that are unrelated to segregation or integration.
- 187See Trafficante v Metropolitan Life Insurance Co, 409 US 205, 206–07 (1972).
- 188Id at 208.
- 189See Gladstone, Realtors v Village of Bellwood, 441 US 91, 93, 109–10 (1979) (noting allegations that steering “is affecting the village’s racial composition, replacing what is presently an integrated neighborhood with a segregated one”); Havens Realty Corp v Coleman, 455 US 363, 376 (1982).
- 190Gladstone, 441 US at 111. See also Havens, 455 US at 376.
- 191Trafficante, 409 US at 211.
- 192Id, quoting 1968 Civil Rights Act Senate Debate, 90th Cong, 2d Sess at 3422 (cited in note 38) (statement of Sen Mondale). See also Inclusive Communities, 135 S Ct at 2525–26 (“The Court acknowledges the Fair Housing Act’s continuing role in moving the Nation toward a more integrated society.”).
- 19390th Cong, 2d Sess, in 114 Cong Rec 9559 (Apr 10, 1968) (“1968 Civil Rights Act House Debate”) (statement of Rep Celler).
- 194Id at 9591 (statement of Rep Ryan). See also Schwemm, Housing Discrimination § 2:3 at 2-10 (cited in note 6) (“This legislative history makes clear that residential integration is a major goal of the Fair Housing Act, separate and independent of the goal of expanding minority housing opportunities.”); HUD, Implementation of the Fair Housing Act’s Discriminatory Effects Standard, 78 Fed Reg 11460, 11469 (2013) (“[T]he elimination of segregation is central to why the Fair Housing Act was enacted.”).
- 195See Schwemm, Housing Discrimination § 10:2 at 10-6 (cited in note 6) (noting that disparate treatment claims “account for most of the litigation under the Fair Housing Act”).
- 196See United States v Yonkers Board of Education, 837 F2d 1181, 1219 (2d Cir 1987) (citing census statistics about segregation in Yonkers).
- 197See id at 1186–93 (recounting Yonkers’s housing decisions from the 1940s to the 1980s).
- 198Id at 1184. See also id at 1222 (concluding that given “the impact of the City’s decisions,” Yonkers’s claim that there was insufficient evidence of “a segregative purpose” was “frivolous”).
- 199United States v City of Parma, Ohio, 494 F Supp 1049, 1056 (ND Ohio 1980).
- 200Id at 1055. See also id at 1055–65 (discussing the levels and causes of segregation in the Cleveland area).
- 201Id at 1066, 1072. See also id at 1065–94 (discussing Parma’s racially exclusionary policies).
- 202Id at 1097. For other examples of segregation helping to establish discriminatory intent, see Zuch v Hussey, 394 F Supp 1028, 1054 (ED Mich 1975) (involving racial steering by realtors in the Detroit metropolitan area); Kennedy Park Homes Association v City of Lackawanna, 318 F Supp 669, 695 (WDNY 1970) (involving a Buffalo suburb’s refusal to approve low-income housing). See also Valerie Schneider, In Defense of Disparate Impact: Urban Redevelopment and the Supreme Court’s Recent Interest in the Fair Housing Act, 79 Mo L Rev 539, 566 (2014) (“[D]isparate impact evidence can be properly used to help prove disparate treatment claims.”) (emphasis omitted).
- 20324 CFR § 100.500(a). See also Schwemm, Housing Discrimination § 13:12 at 13-41 (cited in note 6) (noting that disparate impact liability arises when “the defendant’s action . . . perpetuate[s] residential segregation in an area”).
- 204The circuits differ in exactly what doctrinal steps follow after a plaintiff has established that a defendant’s practice perpetuates segregation. See Inclusive Communities Project, Inc v Texas Department of Housing and Community Affairs, 747 F3d 275, 281 (5th Cir 2014) (listing various judicial approaches). A 2013 HUD rule recommends that, after a plaintiff makes out a prima facie case, (1) the “defendant has the burden of proving that the challenged practice is necessary to achieve one or more substantial, legitimate, nondiscriminatory interests,” and then (2) if this burden is met, the “plaintiff may still prevail upon proving that the . . . interests supporting the challenged practice could be served by another practice that has a less discriminatory effect.” 24 CFR § 100.500(c)(2)–(3). The Supreme Court recently referred favorably to this framework. See Inclusive Communities, 135 S Ct at 2514–15, 2522–23.
- 205For other examples of zoning restrictions leading to disparate impact liability, see Metropolitan Housing Development Corp v Village of Arlington Heights, 558 F2d 1283, 1290–91 (7th Cir 1977) (involving the perpetuation of segregation due to a Chicago suburb’s refusal to rezone to allow construction of low-income housing); United States v City of Black Jack, Missouri, 508 F2d 1179, 1186 (8th Cir 1974) (involving similar perpetuation due to a St. Louis suburb’s adoption of a zoning ordinance). See also Inclusive Communities, 135 S Ct at 2522 (referring to such cases as “the heartland of disparate-impact liability”).
- 206See Dews v Town of Sunnyvale, Texas, 109 F Supp 2d 526, 529 (ND Tex 2000).
- 207Id at 568–69.
- 208For other examples of public housing placement leading to disparate impact liability, see King v Harris, 464 F Supp 827, 835 (EDNY 1979) (holding that new public housing in a Staten Island neighborhood near the community’s racial tipping point “will insure the ghettoization of the area”), vacd Faymor Development Co v King, 446 US 905 (1980); Blackshear Residents Organization v Housing Authority of City of Austin, 347 F Supp 1138, 1141 (WD Tex 1971) (describing how public housing units in black, Hispanic, and white areas of Austin had racial majorities corresponding to their locations).
- 209The culmination of the litigation was the Supreme Court’s decision in Hills v Gautreaux, 425 US 284 (1976).
- 210See generally Alexander Polikoff, Waiting for Gautreaux: A Story of Segregation, Housing, and the Black Ghetto (Northwestern 2006).
- 211Gautreaux, 425 US at 286.
- 212See id at 306.
- 21342 USC § 3608(d). See also generally HUD, Affirmatively Furthering Fair Housing, 80 Fed Reg 42272 (2015) (announcing a new HUD regulation specifying local jurisdictions’ responsibilities for promoting integration).
- 214For other examples of inadequate integrative effort leading to liability, see N.A.A.C.P. v Secretary of Housing and Urban Development, 817 F2d 149, 156 (1st Cir 1987) (describing HUD as taking an “overly narrow” view of its own duties and not pursuing desegregation with sufficient vigor in the Boston metropolitan area); Shannon v United States Department of Housing and Urban Development, 436 F2d 809, 819–22 (3d Cir 1970) (noting similar conduct by HUD in the Philadelphia metropolitan area). Section 3608(d) itself does not create a private right of action; rather, it enables claims under the Administrative Procedure Act alleging that a federal agency has behaved arbitrarily or capriciously. See N.A.A.C.P., 817 F2d at 157–60.
- 215See Thompson v United States Department of Housing and Urban Development, 348 F Supp 2d 398, 406 (D Md 2005).
- 216See id at 459–60.
- 217See id at 458–64.
- 218Id at 463.
- 219Such forceful measures have been quite rare, though, undertaken in only a small subset of the country’s highly segregated areas.
- 220See Yonkers, 837 F2d at 1184.
- 221See Gautreaux v Pierce, 690 F2d 616, 638 (7th Cir 1982) (approving a consent decree); Gautreaux v Landrieu, 523 F Supp 665, 672 (ND Ill 1981) (same).
- 222See notes 220–21.
- 223See Otero v New York City Housing Authority, 484 F2d 1122, 1128 (2d Cir 1973) (describing actions taken by the Authority to achieve a 60 percent white, 40 percent nonwhite resident makeup at a development). These actions were not taken in response to FHA litigation; rather, they are what prompted the (unsuccessful) suit. For another New York City example of a racial occupancy quota being upheld when necessary to prevent tipping, see Daubner v Harris, 514 F Supp 856, 868 (SDNY 1981) (approving such a policy at a Chelsea public housing development).
- 224Otero, 484 F2d at 1124.
- 225Id at 1133–34.
- 226Gladstone, 441 US at 111.
- 227See Strykers Bay Neighborhood Council, Inc v City of New York, 695 F Supp 1531, 1542 (SDNY 1988) (citing census statistics “show[ing] that the renewal area historically has been a well integrated neighborhood and has become more integrated over time”).
- 228See id.
- 229Id.
- 230See Smith v City of Cleveland Heights, 760 F2d 720, 721 (6th Cir 1985) (describing the city’s policies of maintaining integration by “steering white home buyers to the Cleveland Heights housing market and black home buyers away from the area”).
- 231Id.
- 232Id at 725 (Wellford dissenting) (quotation marks omitted). On appeal, the Sixth Circuit held that the plaintiff had standing because Cleveland Heights’s “steering policies stigmatize him as an inferior member of the community.” Id at 722. The majority noted the plaintiff’s associational argument for standing, and then explicitly declined to address it. Id at 724–25.
- 233City of Joliet v Mid-City National Bank of Chicago, 2014 WL 4667254, *23 (ND Ill).
- 234See id at *4–9.
- 235See id at *23 (noting that “the relocation of 240 [development] families . . . cannot be reasonably believed to affect the overall demographics of Joliet”).
- 236Id. See also id at *17 (“[T]he demographic statistics presented by the parties is conclusive evidence that Joliet does not intend to discriminate against African-Americans.”).
- 237United States v University Oaks Civic Club, 653 F Supp 1469, 1471 (SD Tex 1987).
- 238See id at 1472. However, the homeowners also took steps to reduce the covenants’ effects. See id.
- 239Id at 1473.
- 240Id. See also id at 1475 (commenting that “a highly integrated community . . . is hardly characteristic of the perpetrators of discrimination that the Fair Housing Act has focused upon”). For another example of integration militating against a finding of invidious intent, see Heights Community Congress v Hilltop Realty, Inc, 774 F2d 135, 143 (6th Cir 1985) (finding that a realtor lacked segregative motive when he circulated solicitation cards to homeowners in a “transitional” neighborhood in Cleveland Heights).
- 24124 CFR § 100.500(a). The case law has not yet confronted practices that increase segregation, but are undertaken in areas that are largely integrated. When disputes involving such practices emerge, courts will have to decide if all segregative practices are presumptively unlawful, or only those adopted in segregated areas.
- 242See notes 205–12 and accompanying text.
- 243See Hallmark Developers, Inc v Fulton County, Georgia, 386 F Supp 2d 1369, 1372–80 (ND Ga 2005).
- 244Id at 1371–72.
- 245Id at 1383. See also Hallmark Developers, Inc v Fulton County, Georgia, 466 F3d 1276, 1288 (11th Cir 2006) (“[T]here is no evidence that South Fulton is currently segregated and that Hallmark’s development would end that segregation.”).
- 246See Suffolk Housing Services v Town of Islip, New York, 1996 WL 75282, *2–9 (EDNY).
- 247See id at *1.
- 248Id at *12. The court also noted that some of the public housing erected by Islip had an “integrative effect.” Id at *13. Two more examples of disparate impact claims failing in integrated areas come from the Upper West Side of New York City. See Strykers Bay Neighborhood Council, 695 F Supp at 1542 (rejecting a disparate impact claim against a proposed luxury development); Trinity Episcopal School Corp v Romney, 387 F Supp 1044, 1073 (SDNY 1974) (rejecting a similar claim against a proposed low-income development). And Artisan/American Corp v City of Alvin, Texas, 588 F3d 291 (5th Cir 2009), is a case remarkably similar to Hallmark, with the court rejecting a disparate impact challenge to a city’s denial of a permit for a low-income development due to lack of “evidence that minorities lived in particular areas of town, or that the project would exacerbate such a trend, if it existed.” Id at 299 n 20.
- 249See notes 220–21 and accompanying text. As discussed below, one similarly aggressive court order, in Dallas in the 1990s, was declared unlawful on appeal. See notes 252–54 and accompanying text.
- 250Schwemm, Housing Discrimination § 11A:2 at 11A-17 (cited in note 6).
- 251See Rodney A. Smolla, In Pursuit of Racial Utopias: Fair Housing, Quotas, and Goals in the 1980’s, 58 S Cal L Rev 947, 989 (1985) (“The only reason that racial occupancy controls are needed is that without them too many whites . . . find themselves overwhelmed by fear and bias when faced with . . . substantial numbers of black neighbors.”).
- 252See Walker v City of Mesquite, TX, 169 F3d 973, 976 (5th Cir 1999) (“The history of public housing in Dallas is a sordid tale of overt and covert racial discrimination and segregation.”).
- 253See id at 977 (describing the court order).
- 254Id at 984. See also id (noting that “the number of Section 8 black families living in predominantly white areas increased by . . . 27%” in “the two year period between 1994 and 1996”).
- 255See United States v Charlottesville Redevelopment and Housing Authority, 718 F Supp 461, 471 (WD Va 1989) (invalidating a Charlottesville quota on FHA grounds); United States v Starrett City Associates, 660 F Supp 668, 679 (EDNY 1987) (invalidating a New York City quota on FHA grounds); Burney v Housing Authority of County of Beaver, 551 F Supp 746, 767–70 (WD Pa 1982) (invaliding a Pittsburgh quota on constitutional and FHA grounds).
- 256Burney, 551 F Supp at 766 (quotation marks omitted).
- 257Id at 765. See also Charlottesville, 718 F Supp at 466 n 8 (“[The Charlottesville Redevelopment and Housing Authority] has not demonstrated that a [tipping] demographic similar[ ] to the situation in Otero exists in the instant matter.”); Starrett City, 660 F Supp at 678 (noting the “wide elasticity of [tipping], which ranged ‘from a low of 1% black to a high of 60% black’”).
- 258But see Galster, 2 J Housing Rsrch at 113 (cited in note 113) (finding that levels of housing discrimination and segregation are linked, and thus implying that there may be less discrimination if segregation is lower).
- 259Notably, I am unaware of any affirmative furtherance claims under 42 USC § 3608(d) that have failed on the ground that desegregating residential patterns show that HUD has pursued integration with sufficient vigor.
- 260I am unaware of any comprehensive data on the geographic distribution of FHA cases. However, the country’s fair housing organizations, which bring many FHA claims, are concentrated in more segregated areas. See State and Local Fair Housing Enforcement Agencies (The Leadership Conference, 2016), archived at http://perma.cc/3CWH-9ZZ7.
- 261Trafficante, 409 US at 211.
- 262See notes 100–02 and accompanying text.
- 263See notes 103–15 and accompanying text.
- 264Michael H. Schill, Implementing the Federal Fair Housing Act: The Adjudication of Complaints, in Goering, ed, Fragile Rights within Cities 143, 152 (cited in note 77).
- 265Stacy E. Seicshnaydre, Is Disparate Impact Having Any Impact? An Appellate Analysis of Forty Years of Disparate Impact Claims under the Fair Housing Act, 63 Am U L Rev 357, 393–94 (2013) (surveying appellate FHA cases involving disparate impact claims).
- 266See Richard H. Sander, Housing Segregation and Housing Integration: The Diverging Paths of Urban America, 52 U Miami L Rev 977, 1009 (1998) (concluding that the FHA “was, at least, partly successful in its principal goal of attacking market discrimination”).
- 267See notes 151–54 and accompanying text (discussing how the foreclosure crisis of the late 2000s modestly increased segregation).
- 268See, for example, John P. Relman, Foreclosures, Integration, and the Future of the Fair Housing Act, 41 Ind L Rev 629, 638–47 (2008) (explaining how the FHA was used in one case to challenge reverse redlining practices that led to high foreclosure rates in minority-heavy areas in the late 2000s).
- 269See Turner, et al, Housing Discrimination against Racial and Ethnic Minorities at *40, 51 (cited in note 15).
- 270See id.
- 271See id at *68 (showing a decline in housing discrimination since 1977). See also Schwemm, Housing Discrimination § 11A:1 at 11A-6 (cited in note 6) (noting that “housing providers—particularly landlords—continue to violate [the FHA] at an astonishing rate”); Robert B. Avery, Glenn B. Canner, and Robert E. Cook, New Information Reported under HMDA and Its Application in Fair Lending Enforcement, 91 Fed Res Bull 344, 376, 379 (2005) (finding that blacks are denied housing loans at higher rates than whites, and given worse loan terms, even controlling for an array of nonracial factors).
- 272See Inclusive Communities, 135 S Ct at 2521–22; Havens, 455 US at 376, 381; Gladstone, 441 US at 109–11; Trafficante, 409 US at 208.
- 273Schwemm, Housing Discrimination § 10:5 at 10-38 to -39 (cited in note 6).
- 274See id § 10:2 at 10-5 to -21 (noting the frequency of these cases). See also id § 13:2 at 13-4 to -8 (describing typical antidiscrimination claims).
- 275See Robert G. Schwemm, Discriminatory Effect and the Fair Housing Act, 54 Notre Dame Law 199, 262 (1978) (characterizing “[t]he ‘big’ private housing case” as one aimed at achieving “the congressional goal of an open, integrated society”). But see Shanna L. Smith, The National Fair Housing Alliance at Work, in Robert D. Bullard, J. Eugene Grigsby III, and Charles Lee, eds, Residential Apartheid: The American Legacy 237, 247–48 (California 1994) (listing major antidiscrimination victories under the FHA).
- 276I reiterate my earlier point that antidiscrimination suits under the FHA include both disparate treatment and disparate impact claims. See note 177.
- 277See 52 USC § 10301. The VRA’s other key component, § 5, effectively was nullified in Shelby County, Alabama v Holder, 133 S Ct 2612, 2631 (2013) (striking down the VRA’s coverage formula, which triggers § 5).
- 278Thornburg v Gingles, 478 US 30, 50–51 (1986).
- 279See text accompanying notes 344–47.
- 280Section 2 also prohibits outright disenfranchisement. See 52 USC § 10301(a) (banning “denial . . . of the right . . . to vote on account of race or color”); 52 USC § 10301(b) (explaining that the provision is violated if minority “members have less opportunity than other members of the electorate to participate in the political process”). See also Nicholas O. Stephanopoulos, The South after Shelby County, 2013 S Ct Rev 55, 106–18 (discussing the application of § 2 and § 5 of the VRA to vote-denial claims). Unlike vote dilution, vote denial is not connected to racial groups’ residential patterns, and so I do not discuss it further.
- 28152 USC § 10301(a).
- 28252 USC § 10301(b).
- 28352 USC § 10301(b).
- 284478 US 30 (1986).
- 285See Daniel P. Tokaji, Realizing the Right to Vote: The Story of Thornburg v. Gingles, in Joshua A. Douglas and Eugene D. Mazo, eds, Election Law Stories 127, 158 (Foundation 2016) (“What is perhaps most surprising about the backstory to Gingles is that its now-canonical test for vote dilution did not appear in any of the briefs, the oral argument, nor even in the first draft of Justice Brennan’s opinion.”).
- 286Gingles, 478 US at 50–51.
- 287Id at 50.
- 288Id at 51.
- 289Id.
- 290See Gingles, 478 US at 36–37.
- 291Id at 49, 64, 80.
- 292Id at 50 n 17, 64, 80.
- 293Id at 50 n 17.
- 294Dana R. Carstarphen, The Single Transferable Vote: Achieving the Goals of Section 2 without Sacrificing the Integration Ideal, 9 Yale L & Pol Rev 405, 406 (1991). See also, for example, Pamela S. Karlan, Our Separatism? Voting Rights as an American Nationalities Policy, 1995 U Chi Legal F 83, 87 (“The first [Gingles] element focuses on geographic segregation.”); Lani Guinier, Groups, Representation, and Race-Conscious Districting: A Case of the Emperor’s Clothes, 71 Tex L Rev 1589, 1623 (1993).
Many cases also have held that residentially segregated groups satisfy Gingles’s geographic compactness requirement. See, for example, Askew v City of Rome, 127 F3d 1355, 1371 (11th Cir 1997) (noting that “[n]early three quarters of Rome’s black population . . . lives in majority black census blocks”); Large v Fremont County, Wyoming, 709 F Supp 2d 1176, 1191–92 (D Wyo 2010) (involving a Native American population of which the “vast majority . . . resides on the Reservation” and “is concentrated in [three] communities”); King v State Board of Elections, 979 F Supp 582, 608 (ND Ill 1996) (observing “clustering of Hispanics into two densely populated enclaves” in Chicago). I do not discuss these cases in the main text because the point about compactness and segregation being overlapping concepts seems so clear.
- 295See Nicholas O. Stephanopoulos, Our Electoral Exceptionalism, 80 U Chi L Rev 769, 844 (2013) (noting that single-member districts “can benefit only minority groups that are large and geographically dense”).
- 296Gingles, 478 US at 50. See also id at 50 n 17 (“The single-member district is generally the appropriate standard against which to measure minority group potential to elect.”). The compactness requirement also might be justified on the ground that a segregated minority group is more likely to be the victim of discrimination than an integrated one—and thus in greater need of judicial protection. But this is not the Court’s own explanation for the requirement; the relationship between segregation and discrimination is far from ironclad; and polarization (the focus of Gingles’s next two steps) seems a better proxy for discrimination than segregation.
- 297Segregation, though, does not necessarily increase minority representation. Clusters of minority voters also can be split by district lines, rendering the voters unable to elect their preferred candidates.
- 298See Carl E. Klarner, Redistricting Principles and Racial Representation: A Re-analysis, 7 State Polit & Pol Q 298, 299 (2007); Jason Barabas and Jennifer Jerit, Redistricting Principles and Racial Representation, 4 State Polit & Pol Q 415, 423 (2004). By law, all congressional districts are represented by single members. See 2 USC § 2c.
- 299See Klarner, 7 State Polit & Pol Q at 299 (cited in note 298); Barabas and Jerit, 4 State Polit & Pol Q at 423 (cited in note 298). Klarner also found that more segregated states tend to have higher shares of majority-minority districts. See Klarner, 7 State Polit & Pol Q at 299 (cited in note 298).
- 300This is because the dissimilarity index varies from 0.33 to 0.93 and its regression coefficient is 4.41. See Klarner, 7 State Polit & Pol Q at 299 (cited in note 298); Barabas and Jerit, 4 State Polit & Pol Q at 421, 423 (cited in note 298).
- 301See Gingles, 478 US at 50–51.
- 302See Bernard Grofman, Lisa Handley, and Richard G. Niemi, Minority Representation and the Quest for Voting Equality 82 (Cambridge 1992) (observing that polarization is “the foundation for two of the three prongs of the Gingles test”).
- 303Unlike geographic compactness, the polarization requirement does not stem from an assumption that single-member districts are the only available remedy. Polarization is necessary for there to be racial vote dilution in the first place. If a minority group is not politically cohesive, then there is no minority-preferred candidate. Similarly, if there is no white bloc voting, then there is no enduring obstacle to the election of the minority’s candidate of choice. See Gingles, 478 US at 51.
- 304But see Pamela S. Karlan, Maps and Misreadings: The Role of Geographic Compactness in Racial Vote Dilution Litigation, 24 Harv CR–CL L Rev 173, 203 (1989) (speculating that polarization might be lower in integrated areas). In future work, I plan to assess empirically the polarization-segregation relationship.
- 305See Gingles, 478 US at 52–53 & n 20 (referring to the district court’s finding that “extreme case analysis” is “standard in the literature for the analysis of racially polarized voting”).
- 306See Greiner, 86 Ind L J at 464 (cited in note 30) (referring to a 90 percent cutoff).
- 307For example, if a precinct is 95 percent black and 5 percent white, and a minority candidate of choice wins the precinct by a margin of 85 percent to 15 percent, then the candidate must have won between 84 percent and 89 percent of the black vote. This is a very narrow (and thus very useful) range of possible minority cohesion scores.
- 308Strictly speaking, what is necessary here is a high score on the isolation index, indicating that most minority members live in minority-heavy neighborhoods.
- 309Grofman, Handley, and Niemi, Minority Representation and the Quest for Voting Equality at 85 (cited in note 302). See also Greiner, 86 Ind L J at 464 (cited in note 30) (“[I]f one racial group dominates . . . then the observed vote totals in that precinct can be safely attributed to this racial group alone.”).
- 310See Gingles, 478 US at 52–53 & n 20 (referring to the district court’s finding that “bivariate ecological regression analysis” is “standard in the literature for the analysis of racially polarized voting”). See also Grofman, Handley, and Niemi, Minority Representation and the Quest for Voting Equality at 82–105 (cited in note 302). See also generally Gary King, A Solution to the Ecological Inference Problem: Reconstructing Individual Behavior from Aggregate Data (Princeton 1997).
- 311See Greiner, 86 Ind L J at 464 (cited in note 30) (“Without the bounds to constrain the numbers, impossible results can (and often do) occur.”).
- 312See Christopher S. Elmendorf and Douglas M. Spencer, Administering Section 2 of the Voting Rights Act after Shelby County, 115 Colum L Rev 2143, 2159 (2015) (commenting that ecological regression “works reasonably well when . . . precincts are racially homogenous”).
- 313See Greiner, 47 Jurimetrics at 157 (cited in note 28) (“[E]cological regression is especially problematic when applied to precinct tables of size larger than two by two.”); Greiner, 86 Ind L J at 465–67 (cited in note 30).
- 314For an exhaustive list of cases relying on both homogeneous precinct analysis and ecological regression, generally under segregated conditions, see Greiner, 47 Jurimetrics at 155–57 (cited in note 28).
- 315See Gingles, 478 US at 36–37.
- 316See Ellen Katz, et al, Documenting Discrimination in Voting: Judicial Findings under Section 2 of the Voting Rights Act since 1982, 39 U Mich J L Ref 643, 706 (2006) (noting this trend).
- 317United States v Charleston County, 316 F Supp 2d 268, 292 (D SC 2003).
- 318Id.
- 319See United States v City of Euclid, 580 F Supp 2d 584, 606 (ND Ohio 2008).
- 320Id at 613.
- 321See Gingles, 478 US at 50.
- 322See id at 51.
- 323See id at 36–37 (noting that these factors include “any history of official discrimination” and “the extent to which members of the minority group . . . bear the effects of discrimination”).
- 324Id at 49, 50 n 17.
- 325Gingles, 478 US at 50.
- 326Richard Briffault, Book Review, Lani Guinier and the Dilemmas of American Democracy, 95 Colum L Rev 418, 430 (1995). See also Carstarphen, 9 Yale L & Pol Rev at 410 (cited in note 294) (“Gingles makes it difficult for residentially dispersed minorities to obtain a remedy for vote dilution.”); Karlan, 1995 U Chi Legal F at 89 (cited in note 294).
- 327Bush v Vera, 517 US 952, 1033 (1996) (Stevens dissenting).
- 328Id at 973 (O’Connor) (plurality).
- 329Id at 979 (O’Connor) (plurality).
- 330East Jefferson Coalition for Leadership and Development v Parish of Jefferson, 691 F Supp 991, 1006–07 (ED La 1988).
- 331Id at 1007.
- 332Id. For additional examples of integrated minority groups failing to comply with Gingles’s geographic compactness requirement, see Shaw v Hunt, 517 US 899, 916 (1996) (“Shaw II”) (“No one looking at District 12 could reasonably suggest that the district contains a ‘geographically compact’ population of any race.”); Potter v Washington County, Florida, 653 F Supp 121, 129 (ND Fla 1986) (finding no geographic compactness when the black population was “dispersed throughout Washington County”).
It also is worth noting that residential integration is not the only geographic scenario that can prevent Gingles’s first prong from being satisfied. Several cases have held that when minorities live in numerous separate communities—even segregated ones—they do not form a compact population required by § 2 to be placed into the same district. See, for example, Sensley v Albritton, 385 F3d 591, 597 (5th Cir 2004) (involving a proposed district with “two areas of highly-concentrated African–American population . . . linked together by a narrow corridor”); Johnson v Mortham, 926 F Supp 1460, 1471–72 (ND Fla 1996) (“In order to achieve its goal of creating a minority-majority district in northeast Florida, the court was forced to link these widely dispersed population concentrations together.”); Terrazas v Clements, 581 F Supp 1329, 1358 (ND Tex 1984) (“[T]he district lines merely fail to string together dispersed pockets of [H]ispanic population.”).
- 333Miller v Johnson, 515 US 900, 916 (1995).
- 334Vera, 517 US at 966, 975 (O’Connor) (plurality).
- 335See generally Shaw II, 517 US 899.
- 336Shaw v Reno, 509 US 630, 634 (1993) (“Shaw I”); Shaw II, 517 US at 918 (invalidating this district).
- 337Shaw I, 509 US at 647. The converse of this proposition is true as well: Districts enclosing segregated minority populations are unlikely to be unconstitutional, because they usually can be justified on nonracial grounds such as compactness and respect for communities of interest. See, for example, Lawyer v Department of Justice, 521 US 567, 581 (1997) (upholding a Tampa Bay district that “comprise[d] a predominantly urban, low-income population”); Shaw I, 509 US at 646 (“[W]hen members of a racial group live together in one community, a reapportionment plan that concentrates . . . the group in one district . . . may reflect wholly legitimate purposes.”).
- 338See Grofman, Handley, and Niemi, Minority Representation and the Quest for Voting Equality at 88–89 (cited in note 302) (“[I]t may not always be possible to use [homogeneous precinct analysis] because of the absence of sufficiently homogeneous precincts.”); Greiner, 86 Ind L J at 463–64 (cited in note 30).
- 339See Greiner, 86 Ind L J at 464–68 (cited in note 30). See also Grofman, Handley, and Niemi, Minority Representation and the Quest for Voting Equality at 104 (cited in note 302) (noting that “situations . . . in which federal courts have failed to find the results of [polarization] methods to be reliable” include those where “minority populations were heavily intermingled”); Elmendorf and Spencer, 115 Colum L Rev at 2159 (cited in note 312) (“[A]s neighborhoods become less homogeneous, the amount of information about racial voting patterns in the precinct-level data becomes very sparse.”).
- 340Greiner, 86 Ind L J at 462 (cited in note 30).
- 341Romero v City of Pomona, 665 F Supp 853, 859 (CD Cal 1987).
- 342Id at 866. For another example of a court rejecting homogeneous precinct analysis, see Rollins v Fort Bend Independent School District, 89 F3d 1205, 1215 n 17 (5th Cir 1996) (“[P]laintiffs’ extreme case analyses . . . were unreliable because they did not involve precincts containing populations with a particular race comprising ninety percent of the precinct.”).
- 343Alabama Legislative Black Caucus v Alabama, 989 F Supp 2d 1227, 1270 (MD Ala 2013), vacd 135 S Ct 1257 (2015). For another example of a court rejecting ecological regression, see Nixon v Kent County, Michigan, 790 F Supp 738, 747 (WD Mich 1992) (“[A] lack of substantial Hispanic concentration in Kent County precludes . . . bivariate ecological regression.”).
- 344See United States v Alamosa County, Colorado, 306 F Supp 2d 1016, 1028–33 (D Colo 2004).
- 345Id at 1020.
- 346Id at 1020, 1036.
- 347See id at 1038.
- 348See note 259 and accompanying text.
- 349See note 260 and accompanying text.
- 350Trafficante v Metropolitan Life Insurance Co, 409 US 205, 211 (1972). See also Part II.C.
- 35152 USC § 10301(b).
- 35252 USC § 10301(b). Representatives of minorities’ choice are not necessarily identical to representatives who are minority members themselves. The former term refers to politicians preferred by minority voters, while the latter denotes politicians of a particular race, regardless of the support they enjoy from minority voters.
- 353Voting Rights Act Extension, S Rep No 97-417, 97th Cong, 2d Sess 29 (1982). See also Gingles, 478 US at 48 n 15 (1986) (describing this factor as one of “the most important . . . bearing on § 2 challenges to multimember districts”).
- 354S Rep No 97-417 at 16 (cited in note 353). And in the case law, the Supreme Court has made a minority group’s deviation from proportional representation one of the linchpins of § 2 doctrine. See Johnson v De Grandy, 512 US 997, 1025 (1994) (O’Connor concurring) (“The opinion’s central teaching is that proportionality . . . is always relevant evidence in determining vote dilution.”).
- 355See note 280. It is also true that an argument can be made that § 2 seeks to provide representation only to coherent geographic communities of minority voters. Indeed, I previously have advanced such a claim myself. See Nicholas O. Stephanopoulos, Redistricting and the Territorial Community, 160 U Pa L Rev 1379, 1416–19 (2012). The trouble with this claim is that it is based on Gingles and its progeny, not the statutory text or legislative history. There is virtually no indication in the text or history that Congress intended for § 2 to be limited to compact minority clusters. See Karlan, 24 Harv CR–CL L Rev at 199 (cited in note 304) (“Geographic concerns played only a minor role in the legislative history of amended Section 2.”).
- 356See, for example, S Rep No 97-417 at 96 (cited in note 353) (statement of Sen Hatch) (claiming that the amendments create a “clear and inevitable mandate for proportional representation”).
- 357Holder v Hall, 512 US 874, 892–93 (1994) (Thomas concurring in the judgment).
- 358Richard H. Pildes, The Decline of Legally Mandated Minority Representation, 68 Ohio St L J 1139, 1146–47 (2007).
- 359Lani Guinier, The Triumph of Tokenism: The Voting Rights Act and the Theory of Black Electoral Success, 89 Mich L Rev 1077, 1078 (1991).
- 360For other scholars criticizing Gingles’s first prong, see Carstarphen, 9 Yale L & Pol Rev at 418 (cited in note 294) (“[T]he courts should begin by eliminating the compactness requirement.”); Karlan, 24 Harv CR–CL L Rev at 202–03 (cited in note 304). Precisely because of the incongruity of linking minority representation to residential segregation, the California Voting Rights Act, which otherwise mirrors its federal analogue, does not compel a showing of compactness. See Sanchez v City of Modesto, 145 Cal App 4th 660, 667 (2006).
- 361For an early critique of racial gerrymandering doctrine, see T. Alexander Aleinikoff and Samuel Issacharoff, Race and Redistricting: Drawing Constitutional Lines after Shaw v. Reno, 92 Mich L Rev 588, 650 (1993) (noting the doctrine’s “tremendous failings of intellectual coherence and practical application”). For the definitive work on the expressive harm contemplated by the doctrine, see generally Richard H. Pildes and Richard G. Niemi, Expressive Harms, “Bizarre Districts,” and Voting Rights: Evaluating Election-District Appearances after Shaw v. Reno, 92 Mich L Rev 483 (1993).
- 362See Aleinikoff and Issacharoff, 92 Mich L Rev at 618 (cited in note 361) (criticizing racial gerrymandering doctrine because it “condemns ‘race-conscious’ attempts to craft minority districts from scattered minority communities, yet complacently relies upon massive residential discrimination to justify compact majority-minority districts”).
- 363Surveys, of course, have methodological issues of their own, such as high nonresponse rates, potentially nonrepresentative samples, questionable validity, and so on. See, for example, Cottier v City of Martin, 604 F3d 553, 559 (8th Cir 2010) (en banc) (citing these concerns as a reason not to credit an exit poll in a § 2 case).
- 364For example, Survey Sampling International’s price for a short nationwide online survey with two thousand respondents is only about $7,000, according to a quote obtained from the company (on file with the editors).
- 365See generally, for example, Andrew Gelman and Jennifer Hill, Data Analysis Using Regression and Multilevel/Hierarchical Models (Cambridge 2007) (introducing multilevel regression and poststratification techniques).
- 366D. James Greiner and Kevin M. Quinn, Exit Polling and Racial Bloc Voting: Combining Individual-Level and R × C Ecological Data, 4 Annals of Applied Stat 1774, 1777 (2010).
- 367Under cumulative voting, each voter has as many votes as there are seats to be filled, and can allocate these votes as she sees fit (including by casting multiple votes for a single candidate). Under limited voting, each voter has fewer votes than there are seats to be filled, and usually can cast up to one vote per candidate. And under preferential voting, each voter ranks the candidates in her order of preference, and these rankings then are used to fill the seats. See Stephanopoulos, 80 U Chi L Rev at 835 (cited in note 295) (describing these systems).
- 368See id at 846–55 (arguing at length for these systems). For other similar arguments, see Briffault, Book Review, 95 Colum L Rev at 433–34 (cited in note 326); Guinier, 71 Tex L Rev at 1637 (cited in note 294); Karlan, 24 Harv CR–CL L Rev at 221–36 (cited in note 304).
- 369See Shaun Bowler, Todd Donovan, and David Brockington, Electoral Reform and Minority Representation: Local Experiments with Alternative Elections 100–01 (Ohio State 2003).
- 370Although the Court in Shelby County invited Congress to act, Congress has not done so. See Shelby County, 133 S Ct at 2631 (noting that “Congress may draft another formula based on current conditions”).
- 371See, for example, Bartlett v Strickland, 556 US 1, 26 (2009) (Kennedy) (plurality) (holding that the first Gingles prong is satisfied only if it is possible to draw an additional majority-minority district); id at 21–23 (Kennedy) (plurality) (seeking to avoid “serious constitutional concerns [about § 2] under the Equal Protection Clause”). Another argument against the first two proposals is that, while they might lead to greater descriptive representation for minorities, this benefit could come at the cost of reduced substantive representation. See, for example, Charles Cameron, David Epstein, and Sharyn O’Halloran, Do Majority-Minority Districts Maximize Substantive Black Representation in Congress?, 90 Am Polit Sci Rev 794, 804–09 (1996) (finding empirically that the answer to the title’s question is no). But see Adam B. Cox and Richard T. Holden, Reconsidering Racial and Partisan Gerrymandering, 78 U Chi L Rev 553, 586–90 (2011) (explaining that there is no necessary tension between descriptive and substantive representation for minorities).
- 372See Charles T. Clotfelter, After Brown: The Rise and Retreat of School Desegregation 57 (Princeton 2004) (giving reasons for considering both school districts and metropolitan areas); John R. Logan, Deirdre Oakley, and Jacob Stowell, School Segregation in Metropolitan Regions, 1970–2000: The Impacts of Policy Choices on Public Education, 113 Am J Sociology 1611, 1622 (2008) (same).
- 373See Reardon and Owens, 40 Ann Rev Sociology at 201 (cited in note 34).
- 374See id.
- 375See Jeremy E. Fiel, Decomposing School Resegregation: Social Closure, Racial Imbalance, and Racial Isolation, 78 Am Sociological Rev 828, 829 (2013) (noting that because “measures of exposure are confounded with the population’s racial composition . . . [m]any sociologists [ ] prefer measures of racial imbalance—also known as unevenness—to study school segregation”). See also, for example, John Logan, Resegregation in American Public Schools? Not in the 1990s *3 (Lewis Mumford Center for Comparative Urban and Regional Research, Apr 26, 2004), archived at http://perma.cc/3MTB-XPE2.
- 376See Logan, Oakley, and Stowell, 113 Am J Sociology at 1622 (cited in note 372).
- 377See id at 1628.
- 378See id at 1627.
- 379See Kori J. Stroub and Meredith P. Richards, From Resegregation to Reintegration: Trends in the Racial/Ethnic Segregation of Metropolitan Public Schools, 1993–2009, 50 Am Educ Rsrch J 497, 509–11 (2013).
- 380See id at 509–12.
- 381For more studies confirming this account, see Brian P. An and Adam Gamoran, Trends in School Racial Composition in the Era of Unitary Status, in Claire E. Smrekar and Ellen B. Goldring, eds, From the Courtroom to the Classroom: The Shifting Landscape of School Desegregation 19, 26 (Harvard 2009) (showing the stability of various entropy indices from 1990 to 2000); Clotfelter, Vigdor, and Ladd, 8 Am L & Econ Rev at 358 (cited in note 35) (showing the stability of several segregation metrics over the period from 1993 to 2003); Fiel, 78 Am Sociological Rev at 829 (cited in note 375) (showing a slight decrease in the white-nonwhite entropy index over the period from 1993 to 2010); Frankenberg, 45 Educ & Urban Society at 555 (cited in note 36) (showing a small decline in the black-white dissimilarity index from 2000 to 2010); Christine H. Rossell and David J. Armor, The Effectiveness of School Desegregation Plans, 1968-1991, 24 Am Polit Q 267, 274 (1996) (showing a decline in the black-white dissimilarity index from 1968 to 1991); Finis Welch and Audrey Light, New Evidence on School Desegregation *39–43 (United States Commission on Civil Rights, June 1987), archived at http://perma.cc/784T-WVQX (showing changes in the dissimilarity index from 1967 to 1985 for 125 different districts).
- 382See Erica Frankenberg, Chungmei Lee, and Gary Orfield, A Multiracial Society with Segregated Schools: Are We Losing the Dream? *30–31 (Civil Rights Project, Jan 2003), archived at http://perma.cc/5AUD-V5GP; Gary Orfield and Erica Frankenberg, Brown at 60: Great Progress, a Long Retreat, and an Uncertain Future *18 (Civil Rights Project, May 15, 2014), archived at http://perma.cc/8BCA-FG79.
- 383See An and Gamoran, Trends in School Racial Composition in the Era of Unitary Status at 20 (cited in note 381); Clotfelter, Vigdor, and Ladd, 8 Am L & Econ Rev at 381 (cited in note 35) (“[T]he rise in this measure is the result of demographic change rather than any growing racial imbalance among schools.”); Fiel, 78 Am Sociological Rev at 839 (cited in note 375) (showing that black-white and Hispanic-white exposure would have increased substantially from 1993 to 2010 had it not been for the declining white share of the student population); Logan, Oakley, and Stowell, 113 Am J Sociology at 1637 (cited in note 372); Reardon and Owens, 40 Ann Rev Sociology at 203–04 (cited in note 34); Stroub and Richards, 50 Am Educ Rsrch J at 499 (cited in note 379).
- 384Whites now make up roughly half of the students in public schools, down from about 80 percent in the late 1960s. See Danielle Holley-Walker, A New Era for Desegregation, 28 Ga St U L Rev 423, 431 (2012). See also Grace Kena, et al, The Condition of Education 2015 *80 (National Center for Educational Statistics, May 2015), archived at http://perma.cc/GJQ5-A6UW (listing past and predicted future school enrollment by race and ethnicity for 2002, 2012, and 2024).
- 385See Gary Orfield, John Kucsera, and Genevieve Siegel-Hawley, E Pluribus . . . Separation: Deepening Double Segregation for More Students *22 (Civil Rights Project, Sept 2012), archived at http://perma.cc/95XX-Z865 (showing a decline in the share of white classmates for the typical white student).
- 386Logan, Resegregation in American Public Schools? at *1 (cited in note 375). See also, for example, An and Gamoran, Trends in School Racial Composition in the Era of Unitary Status at 24 (cited in note 381) (“[O]ne cannot make inferences about school segregation from exposure rates.”); Clotfelter, Vigdor, and Ladd, 8 Am L & Econ Rev at 381 (cited in note 35) (commenting that the isolation index “may have lost much of its meaning as a measure of racial segregation”). See also Milliken v Bradley, 418 US 717, 747 n 22 (1974) (dismissing the claim that “‘actual desegregation’ could not be accomplished as long as the number of Negro students was greater than the number of white students”).
- 387See Sean F. Reardon and John T. Yun, Integrating Neighborhoods, Segregating Schools: The Retreat from School Desegregation in the South, 1990–2000, 81 NC L Rev 1563, 1564–65 (2003) (offering a similar set of explanations for school segregation). Also importantly, the causality between residential and school segregation runs in both directions. School desegregation orders often cause whites to move out of school districts, thus increasing residential segregation. See Nathaniel Baum-Snow and Byron F. Lutz, School Desegregation, School Choice, and Changes in Residential Location Patterns by Race, 101 Am Econ Rev 3019, 3033 (2011). However, this effect is muted when less aggressive desegregative techniques are used, see Rossell and Armor, 24 Am Polit Q at 288 (cited in note 381), and when school districts encompass most of their metropolitan areas, see Kendra Bischoff, School District Fragmentation and Racial Residential Segregation: How Do Boundaries Matter?, 44 Urban Affairs Rev 182, 199 (2008).
- 388The consensus in the literature is that school choice policies and private school enrollment cause small increases in school segregation. White students are more likely to take advantage of these options, and then more likely to make enrollment decisions that have segregative consequences. See, for example, An and Gamoran, Trends in School Racial Composition in the Era of Unitary Status at 22 (cited in note 381) (finding that “inclusion of private schools in our analysis does little to change the overall levels of school segregation”); Fiel, 78 Am Sociological Rev at 842–43 (cited in note 375); Meredith P. Richards, The Gerrymandering of School Attendance Zones and the Segregation of Public Schools: A Geospatial Analysis, 51 Am Educ Rsrch J 1119, 1120 (2014); Saporito and Sohoni, 79 Sociology of Educ at 94 (cited in note 47) (finding that the black-white dissimilarity index is slightly higher than expected due to white exit to charter and private schools).
- 389See notes 391–403 and accompanying text.
- 390See Milliken, 418 US at 745 (holding that an interdistrict remedy is available only if there has been an interdistrict violation). According to the literature, the consolidation of school districts substantially improves school segregation (and vice versa). See, for example, Paul M. Ong and Jordan Rickles, The Continued Nexus between School and Residential Segregation, 19 Berkeley Women’s L J 379, 387 (2004) (“Metropolitan areas where the primary school students are concentrated in a few districts . . . are more likely to have [low] school segregation levels.”); Sarah J. Reber, Court-Ordered Desegregation: Successes and Failures Integrating American Schools since Brown versus Board of Education, 40 J Hum Res 559, 580 (2005) (finding that a larger number of school districts in a metropolitan area reduces the nonwhite-white exposure index).
- 391See Sean F. Reardon, et al, Brown Fades: The End of Court-Ordered School Desegregation and the Resegregation of American Public Schools, 31 J Pol Analysis & Mgmt 876, 882 (2012) (identifying the 755 school districts that were ever subject to court desegregation orders); Reber, 40 J Hum Res at 561 (cited in note 390) (showing the geography and timing of court desegregation orders).
- 392See Rossell and Armor, 24 Am Polit Q at 278–82 (cited in note 381) (discussing the prevalence of these techniques over time).
- 393See id at 291.
- 394See Reber, 40 J Hum Res at 568–69 (cited in note 390).
- 395See id.
- 396See, for example, Rucker C. Johnson, Long-Run Impacts of School Desegregation & School Quality on Adult Attainments *11, 15–16 (NBER Working Paper No 16664, Jan 2011), archived at http://perma.cc/4D5T-KCBV (using the same analytical design and finding that desegregation orders reduce the black-white dissimilarity index by about 20 percentage points); Rossell and Armor, 24 Am Polit Q at 292 (cited in note 381) (finding a 15 percentage point reduction for the black-white dissimilarity index); Welch and Light, New Evidence on School Desegregation at *50 (cited in note 381) (finding a 23 percentage point reduction for the black-white dissimilarity index). See also Logan, Oakley, and Stowell, 113 Am J Sociology at 1631 (cited in note 372) (finding that the metropolitan school dissimilarity index decreased in 1990 and 2000 as the share of children subject to a desegregation order increased).
- 397See generally Missouri v Jenkins, 515 US 70 (1995); Freeman v Pitts, 503 US 467 (1992); Board of Education of Oklahoma City Public Schools v Dowell, 498 US 237 (1991) (“Dowell I”). See also Reardon, et al, 31 J Pol Analysis & Mgmt at 887 (cited in note 391) (showing dismissals of desegregative orders from 1991 to 2009).
- 398See Reardon, et al, 31 J Pol Analysis & Mgmt at Appendix Table A1 (cited in note 391).
- 399See id at 899 (noting that evidence supports the view that “most districts adopt neighborhood-based school assignment policies following the release from court order”).
- 400See id at 891–99.
- 401See id at 891–92.
- 402See, for example, An and Gamoran, Trends in School Racial Composition in the Era of Unitary Status at 41–42 (cited in note 381) (finding that unitary status increases the black-white entropy index by 2 to 6 percentage points); Clotfelter, Vigdor, and Ladd, 8 Am L & Econ Rev at 377 (cited in note 35) (noting a 5 percentage point increase for the white-nonwhite dissimilarity index); Byron Lutz, The End of Court-Ordered Desegregation, 3 Am Econ J: Econ Pol 130, 145 (2011) (finding a 6 percentage point increase for the black-white dissimilarity index).
- 403For examples of other scholars taking similar positions, see An and Gamoran, Trends in School Racial Composition in the Era of Unitary Status at 22 (cited in note 381) (“[H]ad it not been for declarations of unitary status, school segregation would have declined.”); Clotfelter, Vigdor, and Ladd, 8 Am L & Econ Rev at 366 (cited in note 35); Frankenberg, 45 Educ & Urban Society at 551 (cited in note 36); Reardon and Owens, 40 Ann Rev Sociology at 207 (cited in note 34) (“[T]his decline in residential segregation . . . offset some of the increasing segregation due to the decline in desegregation efforts.”).
- 404See Reardon, et al, 31 J Pol Analysis & Mgmt at Appendix Table A1 (cited in note 391); School Districts (US Census Bureau, June 15, 2012), archived at http://perma.cc/42W4-GQBG.
- 405Logan, Oakley, and Stowell, 113 Am J Sociology at 1631 (cited in note 372) (using the dissimilarity index to measure segregation). Unfortunately, none of the studies that jointly examine residential and school segregation do so at the school district (as opposed to metropolitan area) level. How the two measures are related at this level thus is unknown.
- 406Erica Frankenberg, Metropolitan Schooling and Housing Integration, 18 J Affordable Housing & Community Dev L 193, 204 (2009) (using the dissimilarity index). Other studies also have found an increase in the correlation between residential and school segregation during the 1990s. See, for example, An and Gamoran, Trends in School Racial Composition in the Era of Unitary Status at 36 (cited in note 381) (using the entropy index); Reardon and Yun, 81 NC L Rev at 1590–93 (cited in note 387) (using the entropy index and analyzing the South only).
- 407Frankenberg, 45 Educ & Urban Society at 557–58 (cited in note 36) (using the dissimilarity index).
- 408See id at 558–59.
- 409Logan, Oakley, and Stowell, 113 Am J Sociology at 1627–28 (cited in note 372) (top-left graph constructed from Logan, Oakley, and Stowell’s data); Stroub and Richards, 50 Am Educ Rsrch J at 510 (cited in note 379) (top-right graph constructed from Stroub and Richards’s data); Reber, 40 J Hum Res at 569 (cited in note 390) (middle-left graph); Reardon, et al, 31 J Pol Analysis & Mgmt at 892 (cited in note 391) (middle-right graph); Frankenberg, 45 Educ & Urban Society at 557 (cited in note 36) (bottom-left graph); Frankenberg, 45 Educ & Urban Society at 558 (cited in note 36) (bottom-right graph).
- 410See, for example, Keyes v School District No 1, Denver, Colorado, 413 US 189, 208 (1973) (noting that “the differentiating factor between de jure segregation and so-called de facto segregation . . . is purpose or intent to segregate”).
- 411As throughout the Article, I deal here with the legal implications of de facto, not de jure, residential segregation. De jure residential segregation can lead to liability even more directly since, assuming it causes de facto school segregation, segregative intent does not have to be inferred. An invidious motive is established by the de jure segregation. See Milliken, 418 US at 755 (Stewart concurring) (noting that “purposeful[ ] racially discriminatory use of state housing or zoning laws” can result in liability in school desegregation cases and justify imposition of interdistrict remedies).
- 412See Blocker v Board of Education of Manhasset, New York, 226 F Supp 208, 211 (EDNY 1964).
- 413Id at 229.
- 414See id at 211–12, 226.
- 415Id at 226.
- 416Cisneros v Corpus Christi Independent School District, 467 F2d 142, 146 (5th Cir 1972) (en banc).
- 417Id. See also id at 145–46 (providing school segregation statistics).
- 418Id at 149. For other examples of residential segregation giving rise to school segregation and then to liability, see Hart v Community School Board of Brooklyn, New York School District #21, 383 F Supp 699, 755 (EDNY 1974) (“We cannot ignore the fact that the system of geographic school attendance, imposed upon segregated housing patterns, provides the broad base for racial isolation.”) (quotation marks and brackets omitted); Bradley v School Board of City of Richmond, Virginia, 338 F Supp 67, 84 (ED Va 1972) (“School authorities may not constitutionally arrange an attendance zone system which serves only to reproduce in school facilities the prevalent pattern of housing segregation.”).
- 419Notably, all of the cases of this kind that I have found predate Washington v Davis, 426 US 229 (1976), in which the Supreme Court clarified that the Equal Protection Clause is violated by discriminatory intent, not discriminatory effect. See id at 238–39. This suggests that Washington, as intended, stopped courts from finding constitutional violations when the best (or only) evidence of improper purpose was a disparate impact.
- 420Ronna Greff Schneider, 1 Education Law: First Amendment, Due Process and Discrimination Litigation § 5:9 at 1032 (Thomson West 2004). See also, for example, Dayton Board of Education v Brinkman, 433 US 406, 413 (1977) (noting that school segregation “is not a violation of the Fourteenth Amendment in the absence of a showing that this condition resulted from intentionally segregative actions”).
- 421Keyes, 413 US at 260 (Rehnquist dissenting).
- 422Id at 191.
- 423Id at 192.
- 424Id at 198.
- 425Columbus Board of Education v Penick, 443 US 449, 506 (1979) (Rehnquist dissenting).
- 426Id at 461 n 8 (quotation marks omitted).
- 427Id at 462 n 9.
- 428Id at 462 n 10.
- 429Penick, 433 US at 463–64. For other examples of residential segregation enabling school district policies to have a segregative effect, from which segregative intent then is inferred, see Swann v Charlotte-Mecklenburg Board of Education, 402 US 1, 7 (1971) (involving “locating schools in Negro residential areas and fixing the size of the schools”); United States v Texas Education Agency, 564 F2d 162, 171 (5th Cir 1977) (involving “the construction and abandonment of schools, the selection of school sites, . . . and the drawing of student attendance zones”).
- 430See Lutz, 3 Am Econ J: Econ Pol at 133 (cited in note 402). Of course, multiple school desegregation suits have been brought in this period. See Holley-Walker, 28 Ga St U L Rev at 433–42 (cited in note 384) (discussing several such cases).
- 431See notes 397–98 and accompanying text.
- 432Dowell I, 498 US at 250.
- 433See Green v County School Board of New Kent County, 391 US 430, 435 (1968) (noting that racial imbalances can exist not only in the “composition of student bodies” but also in “faculty, staff, transportation, extracurricular activities and facilities”).
- 434United States v Fordice, 505 US 717, 745 (1992) (Thomas concurring). See also Freeman, 503 US at 505 (Scalia concurring) (describing the “presumption, effectively irrebuttable . . . that any current racial imbalance is the product of that violation, at least if the imbalance has continuously existed”).
- 435Newburg Area Council, Inc v Board of Education of Jefferson County, Kentucky, 489 F2d 925, 929 (6th Cir 1973).
- 436Id at 928.
- 437Id at 929.
- 438Tasby v Wright, 520 F Supp 683, 701 (ND Tex 1981).
- 439See id at 699–700 (noting the rise of the minority student population from 42 percent in 1970 to 70 percent in 1980).
- 440See id at 713–44.
- 441See id at 714.
- 442See Tasby, 520 F Supp at 748 (“[M]ost minorities would prefer to stay at home than travel to a far distant school that can still accept transfers of minority students.”).
- 443See id at 692–95.
- 444Id at 706. For other examples of unitary status being denied in part due to the impact of residential segregation on school segregation, see Davis v East Baton Rouge Parish School Board, 721 F2d 1425, 1435 (5th Cir 1983) (“The Board’s reliance on housing patterns as justification for the continued existence of one-race schools is not only factually but legally unsound.”); Adams v United States, 620 F2d 1277, 1289–90 (8th Cir 1980) (en banc) (explaining how residential segregation interacted with school district policies to produce school segregation after the entry of the original desegregation order).
- 445See James E. Ryan, The Limited Influence of Social Science Evidence in Modern Desegregation Cases, 81 NC L Rev 1659, 1671 (2003) (“[D]emographic changes that occur after a court has implemented a desegregation decree can suffice to sever the link between prior acts of segregation and current levels of racial imbalance.”).
- 446See Freeman, 503 US at 477.
- 447Id at 475.
- 448Id at 476.
- 449Id at 494, 496. For other examples of residential segregation helping school districts achieve unitary status, see Pasadena City Board of Education v Spangler, 427 US 424, 436 (1976) (granting unitary status where enrollment imbalances were caused by “changes in the demographics of Pasadena’s residential patterns” and not by “any segregative actions”); Ross v Houston Independent School District, 699 F2d 218, 219–20 (5th Cir 1983) (granting unitary status where “the homogeneous student composition of the schools does not stem from the unconstitutional segregation . . . but from population changes that have occurred since this litigation commenced”).
- 450See generally Vaughns v Board of Education of Prince George’s County, 574 F Supp 1280 (D Md 1983), affd in part, revd in part, 758 F2d 983 (4th Cir 1985).
- 451Vaughns, 574 F Supp at 1364–65. See also id at 1319 (noting that the residential dissimilarity index in the county “dipped from 62 in 1970 to 50 in 1980”).
- 452See id at 1363 (describing a gap between the predicted rise in school segregation due to the busing cutback and the rise that actually occurred).
- 453Id at 1370.
- 454Bowman v County School Board of Charles City County, Virginia, 293 F Supp 1201, 1205 (ED Va 1968).
- 455See id at 1203.
- 456See Green, 391 US at 440 (“[T]he general experience under ‘freedom of choice’ to date has been such as to indicate its ineffectiveness as a tool of desegregation.”).
- 457Bowman, 293 F Supp at 1204–05.
- 458Id at 1206. For another example of residential integration helping to prevent segregative intent from being inferred, see Price v Austin Independent School District, 945 F2d 1307, 1316 (5th Cir 1991) (upholding a ruling in favor of an Austin school district where there was “ongoing dispersion of Black persons . . . into areas formerly dominated by majority persons”).
- 459People Who Care v Rockford Board of Education, School District # 205, 851 F Supp 905, 1205 (ND Ill 1994).
- 460Id.
- 461Id.
- 462See Freeman, 503 US at 474 (“[A] critical beginning point is the degree of racial imbalance in the school district.”).
- 463See Dowell v Board of Education of Oklahoma City Public Schools, 778 F Supp 1144, 1164 (WD Okla 1991) (“Dowell II”) (citing the projected score for 1992).
- 464Id at 1156.
- 465See id at 1173.
- 466Id at 1148.
- 467Flax v Potts, 725 F Supp 322, 329 (ND Tex 1989).
- 468Id.
- 469Id at 324.
- 470Id.
- 471Flax, 725 F Supp at 330. For other examples of residential integration helping school districts seeking unitary status, see Reed v Rhodes, 179 F3d 453, 456, 458 (6th Cir 1999) (exempting from further remedial measures “schools in which surrounding neighborhoods were racially integrated”); Davis v School District of the City of Pontiac, 95 F Supp 2d 688, 694, 698 (ED Mich 2000) (granting unitary status where “integration of the schools was being achieved naturally with the change in the racial composition of the community”).
- 472See generally Brown v Board of Education of Topeka, Shawnee County, Kansas, 978 F2d 585 (10th Cir 1992) (“Topeka II”); Brown v Board of Education of Topeka, Shawnee County, Kansas, 892 F2d 851 (10th Cir 1989) (“Topeka I”), vacd, 503 US 978 (1992).
- 473Topeka I, 892 F2d at 856.
- 474Id at 867, 885 (quotation marks omitted).
- 475See id at 889. See also Topeka II, 978 F2d at 593 (reinstating the Topeka I opinion after it was vacated by the Supreme Court).
- 476See notes 259, 348–49, and accompanying text.
- 477See notes 376–81 and accompanying text.
- 478See note 430 and accompanying text.
- 479See Part II.C.
- 480Green, 391 US at 436.
- 481See Part IV.A.
- 482For a useful survey, see generally James E. Ryan, The Supreme Court and Voluntary Integration, 121 Harv L Rev 131 (2007).
- 483See, for example, Parents Involved in Community Schools v Seattle School District No. 1, 551 US 701, 747–48 (2007) (striking down Seattle and Louisville racial assignment policies).
- 484See Erica Frankenberg and Genevieve Siegel-Hawley, Public Decisions and Private Choices: Reassessing the School-Housing Segregation Link in the Post-Parents Involved Era, 48 Wake Forest L Rev 397, 422 (2013) (discussing a study concluding that “geographically based plans would enable [the largest metropolitan school] districts to make meaningful progress toward integration”); Meredith P. Richards, et al, Achieving Diversity in the Parents Involved Era: Evidence for Geographic Integration Plans in Metropolitan School Districts, 14 Berkeley J Afr Am L & Pol 65, 71 (2012) (finding that “segregation rates have remained extremely low since [Berkeley] shift[ed] from a race-based to a geography-based integration plan”).
- 485See Parents Involved, 551 US at 789 (Kennedy concurring in part and concurring in the judgment) (suggesting the validity of policies including “strategic site selection of new schools” and “drawing attendance zones with general recognition of the demographics of neighborhoods”); Doe v Lower Merion School District, 665 F3d 524, 557 (3d Cir 2011) (upholding an attendance zone adjustment aimed at increasing school integration).
- 486See Part I.B.
- 487See Reber, 40 J Hum Res at 568–69 (cited in note 390).
- 488See Welch and Light, New Evidence on School Desegregation at *41 (cited in note 381) (listing ten school districts where the dissimilarity index fell by between 64 and 81 percentage points after judicial intervention).
- 489See notes 405–08 and accompanying text (discussing the high and rising correlation between residential and school segregation).
- 490See note 388 (summarizing the literature on the segregative effects of school choice policies).
- 491See note 430 and accompanying text.
- 492Green, 391 US at 435.
- 493In my view, which I note here but do not defend at length, de facto school integration is both an intrinsic good and one that is appealing because of its positive educational consequences. See Parents Involved, 551 US at 838–45 (Breyer dissenting) (advocating this position at length).
- 494See note 484 and accompanying text.
- 495Frankenberg and Siegel-Hawley, 48 Wake Forest L Rev at 422 (cited in note 484).
- 496See generally Owen M. Fiss, Racial Imbalance in the Public Schools: The Constitutional Concepts, 78 Harv L Rev 564 (1965) (arguing for this position). The logical endpoint of this argument is that school segregation alone, without any evidence of segregative intent, should be enough to establish liability. See, for example, Keyes, 413 US at 198 (carefully avoiding deciding whether “plaintiffs must prove [ ] only that segregated schooling exists” or “also that it was brought about or maintained by intentional state action”). And while on the topic of overruling current precedent, school integration at the metropolitan level could be achieved much more easily if Milliken were reversed and courts could order interdistrict desegregative remedies.
- 497See Parents Involved, 551 US at 747–48.
- 498See notes 445–49 and accompanying text.
- 499See note 430 and accompanying text.
- 500Some of these examples were covered in the liability stage discussions in Parts IV.B–C.
- 501See, for example, Nikole Hannah-Jones, Segregation Now (ProPublica, Apr 16, 2014), archived at http://perma.cc/EFA4-8EAH (describing how “[p]redominantly white neighborhoods” in Tuscaloosa “have been gerrymandered into the attendance zones of other, whiter schools”); Sonali Kohli, Modern-Day Segregation in Public Schools (The Atlantic, Nov 18, 2014), archived at http://perma.cc/7VNA-RQ4P (discussing the use of tracking to produce intraschool segregation).
- 502See Frankenberg, 18 J Affordable Housing & Community Dev L at 196 (cited in note 406) (“In the Northeast and Midwest in particular, the differences in racial composition of students across boundary lines have been suggested as a contributing factor to the high levels of segregation.”).
- 503See Sean F. Reardon, John T. Yun, and Tamela McNulty Eitle, The Changing Structure of School Segregation: Measurement and Evidence of Multiracial Metropolitan-Area School Segregation, 1989–1995, 37 Demography 351, 352 (2000) (commenting on “large urban districts and [ ] countywide districts in parts of the South and the West”).
- 504See Clotfelter, After Brown at 80 (cited in note 372) (noting “increases in interracial contact in some suburban school districts”).
- 505For hints that this kind of campaign already may be underway, see Holley-Walker, 28 Ga St U L Rev at 424 (cited in note 384) (noting “early indications that traditional desegregation cases may be in a period of revival”). Of course, the current Supreme Court is unlikely to be pleased about a resurgence of school desegregation litigation. Lower courts, though, may be more willing to find segregative intent in appropriate cases.
- 506See Michelle Adams, Radical Integration, 94 Cal L Rev 261, 264 (2006) (“Integration no longer captivates the progressive imagination.”); Drew S. Days III, Rethinking the Integrative Ideal: Housing, 33 McGeorge L Rev 459, 459 (2002) (“Nobody talks about racial integration anymore.”).